This site uses cookies. By continuing to browse the ConceptDraw site you are agreeing to our Use of Site Cookies.

SWOT Analysis Software

SWOT analysis is a powerful tool that helps the business professionals to identify the positives and negatives within an organization and in an external environment. TOWS is a variation of SWOT analysis, more focused on external factors and action planning. The correct and full awareness of the situation is important for strategic planning, as well as for decision making and coordination the company's resources and information capabilities of the competitive environment. SWOT and TOWS Matrix Diagrams solution included to ConceptDraw Solution Park makes the ConceptDraw DIAGRAM a powerful SWOT Analysis software and provides a lot of advantages. First of all note the set of ready-made templates that help to identify the Strengths, Weaknesses, Opportunities, and Threats the most quickly and effectively, and the choice of outputs to present the analysis results as SWOT or TOWS matrix. The well-designed SWOT matrix samples and examples included to SWOT and TOWS Matrix Diagrams solution illustrate the results you can achieve using it and also can be used as a good start for your own matrices.

SWOT Matrix Template

SWOT analysis is a structured planning method, which lets define the objective of the business, internal and external factors favorable or unfavorable for achieving this objective, represent Strengths, Weaknesses, Opportunities, and Threats on the SWOT Matrix. SWOT analysis can be conducted for an industry, company, product, place, or person. It lets to choose the best path for development of an organization, helps to avoid dangers, gives opportunity to establish relationship between the potential of an organization and the problems, lets to assess the values of profitability and compare them with performance of competitors, gives the possibility to expand and enhance the competitive advantages. SWOT and TOWS Matrix Diagrams solution included to ConceptDraw Solution Park contains wide variety of SWOT and TOWS matrix diagrams examples and samples, and also specially developed templates. Each SWOT template have great value in easy and quick drawing of SWOT matrices and diagrams in ConceptDraw DIAGRAM diagramming and vector drawing software for Mac OSX and Windows.
HelpDesk

How to Create SWOT Analysis Template

SWOT-analysis is used to develop a marketing strategy. SWOT-analysis includes determining the strengths and weaknesses of the company's activity, potential external threats, and opportunities and assesses their relative strategic competitors. ConceptDraw SWOT and TOWS Matrix Diagrams solution provides a set of SWOT matrix in which should be recorded and then compared the strengths and weaknesses of the enterprise and the market opportunities and threats. This comparison allows you to determine what steps can be taken for the development of your company and what problems need to be addressed urgently.

Total Quality Management Business Diagram

The Total Quality Management Diagram solution helps you and your organization visualize business and industrial processes. Create Total Quality Management diagrams for business process with ConceptDraw software.

SWOT Analysis

Most of the data needed for market analysis (demand, prices, volume of sales, etc.) are undefined, and in future are possible their changes as in the worst and the best side. SWOT analysis is effective method for prediction these processes and decision making for organizations that function in a competitive environment. It allows you to see the whole situation, to identify the strengths and weaknesses of organization (advantages and disadvantages), as well as opportunities and threats of external environment. The results of SWOT analysis are the basis for optimization the business processes, for development by the leading specialists in organization of interrelated complex of strategies and competitive activities. ConceptDraw DIAGRAM software enhanced with SWOT and TOWS Matrix Diagrams Solution will effectively help you in strategic planning for your company, department, project, in development marketing campaign, in identification of four categories of factors of internal and external environment of organization, and construction professional-looking SWOT and TOWS matrices.

SWOT Matrix

SWOT matrix is a structured planning method used to evaluate the strengths, weaknesses, opportunities and threats involved in a project or in a business venture. ConceptDraw DIAGRAM diagramming and vector drawing software extended with SWOT and TOWS Matrix Diagrams Solution from the Management Area will help you design SWOT Matrix of any complexity quick and easy.

SWOT Template

The SWOT and TOWS Matrix Diagrams solution from the ConceptDraw Solution Park gives a simple visual support for all steps of a SWOT analysis process, which is a popular strategic planning method used to evaluate the Strengths, Weaknesses, as well as Opportunities and Threats facing a project. Strengths are the project's characteristics giving it the advantages over the others, weaknesses are the characteristics placing the team at the disadvantage relatively to others, opportunities are the elements that the project can exploit to its advantage and threats are the elements that can cause the troubles. The results of a correctly performed SWOT analysis help to achieve effectively the main objective. The SWOT templates included to SWOT and TOWS Matrix Diagrams solution for ConceptDraw DIAGRAM isually support the identifying of internal and external factors that are favorable or unfavorable. Making the SWOT analysis and completing the SWOT Matrix by simple filling a SWOT template, you can then export it to large variety of available formats: PowerPoint presentation, PDF, image files, and others.

SWOT Analysis Tool for Small Business

SWOT analysis is effective method of making the plan to evaluate the Strengths, Weaknesses, Opportunities, and Threats involved in a project. SWOT analysis includes the specifying project objectives and attentive identifying the internal and external causes for accomplishing the main project goals. It is actively used in large and small business project management for effective and clear identifying the critical factors. SWOT and TOWS Matrix Diagrams solution is included to ConceptDraw Solution Park and contains the high-quality analysis tools. This graphical solution turns the ConceptDraw DIAGRAM software in an excellent marketing management and advertising agency software, the best SWOT analysis tool for small business or large, as you like and need. Included graphic tools, visual and project planning components make it the best marketing project management software for marketing project planning and for making marketing presentations. Use the ConceptDraw DIAGRAM to create professional and well-designed SWOT matrices in minutes.

Create Fishbone Diagrams

Common uses of the Fishbone (Ishikawa) diagrams are product design and quality defect prevention. They are effectively used to identify potential factors causing an overall effect for making possibility to solve a problem. To create Fishbone Diagrams, Cause-and-Effect Diagrams, Ishikawa Diagrams, we recommend to use a ConceptDraw DIAGRAM software enhanced with Fishbone Diagrams solution from the Management area of ConceptDraw Solution Park.

Fishbone Diagram Problem Solving

The Ishikawa diagram, Cause and Effect diagram, Fishbone diagram — all they are the names of one and the same visual method for working with causal connections. Originally invented by Kaoru Ishikawa to control the process quality, the Ishikawa diagram is well proven in other fields of management and personal scheduling, events planning, time management. It is a chart in the form of a fish, whose head is a problem, the fins are variants for its causes. To design easily the Fishbone diagram, you can use a special ConceptDraw DIAGRAM ector graphic and diagramming software which contains the powerful tools for Fishbone diagram problem solving offered by Fishbone Diagrams solution for the Management area of ConceptDraw Solution Park.

SWOT Matrix Software
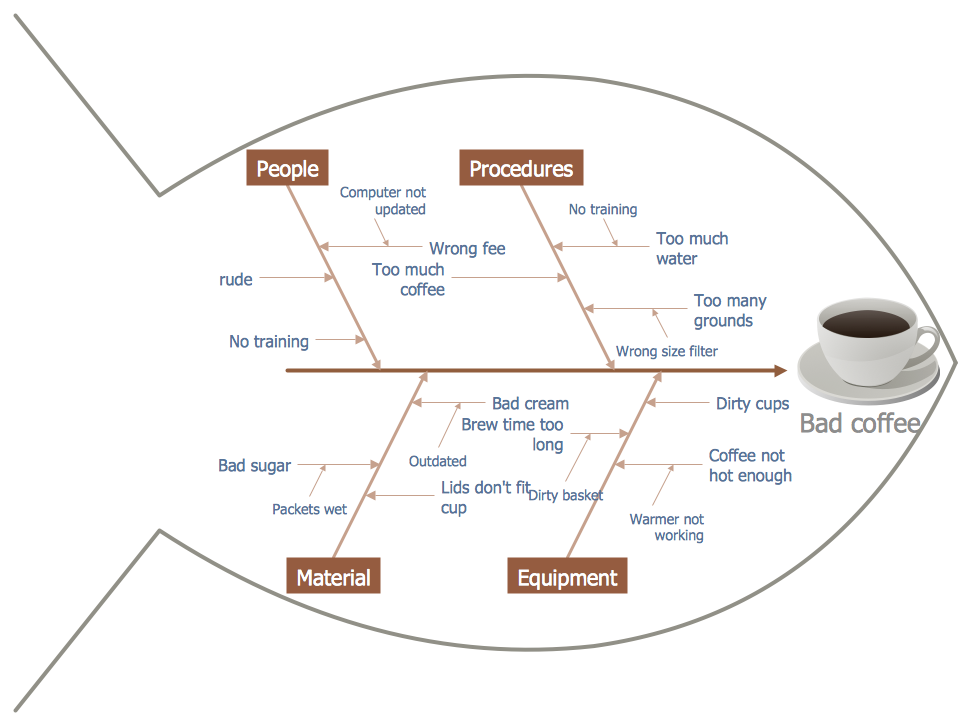
The SWOT Analysis solution from the Management area of ConceptDraw Solution Park contains set of examples, templates and vector design elements of SWOT and TOWS matrices. It helps you to quickly draw SWOT and TOWS analysis matrix diagrams using the best SWOT matrix software ConceptDraw DIAGRAM.

Fishbone Diagram

Fishbone Diagram is another name for the Cause and Effect Diagram or the Ishikawa Diagram which got its name from the fact that it looks like a fish skeleton. Developed by Kaoru Ishikawa in 1968, a Fishbone Diagram is effectively used for a cause and effect analysis which allows to consider all possible causes for a certain problem or event. ConceptDraw DIAGRAM supplied with Fishbone Diagrams solution from the Management area is the best software for fast and easy drawing professional looking Fishbone Diagram.

TOWS Matrix

TOWS Matrix is an effective tool which allows to analize the external opportunities and threats by means of analyzing the internal strengths and weaknesses of a company. ConceptDraw DIAGRAM diagramming and vector drawing software extended with SWOT and TOWS Matrix Diagrams Solution from the Management Area will help design TOWS Matrix for your company without efforts.

Fishbone Diagram Procedure

ConceptDraw DIAGRAM diagramming and vector drawing software enhanced with Fishbone Diagrams solution from the Management area of ConceptDraw Solution Park gives the ability to draw Fishbone diagram, which identifies many possible causes for an effect for problem solving. Fishbone Diagram procedure of creation includes the set of steps easy for execution in ConceptDraw DIAGRAM.

Fishbone Diagram Template

A causal model is an abstract concept, that describes the causal mechanisms of a system, by noting certain variables and their influence on each other, in an effort to discover the cause of a certain problem or flaw. This model is presented in diagram form by using a fishbone diagram. ConceptDraw DIAGRAM diagramming and vector drawing software enhanced with Fishbone Diagrams solution helps you create business productivity diagrams from Fishbone diagram templates and examples, that provide to start using of the graphic method for the analysis of problem causes. Each predesigned Fishbone Diagram template is ready to use and useful for instantly drawing your own Fishbone Diagram.