"Planning (also called forethought) is the process of thinking about and organizing the activities required to achieve a desired goal.
Planning involves the creation and maintenance of a plan. As such, planning is a fundamental property of intelligent behavior. This thought process is essential to the creation and refinement of a plan, or integration of it with other plans; that is, it combines forecasting of developments with the preparation of scenarios of how to react to them.
An important, albeit often ignored aspect of planning, is the relationship it holds with forecasting. Forecasting can be described as predicting what the future will look like, whereas planning predicts what the future should look like. The counterpart to planning is spontaneous order." [Planning. Wikipedia]
The block diagram example "Planning process" was created using the ConceptDraw PRO diagramming and vector drawing software extended with the Block Diagrams solution from the area "What is a Diagram" of ConceptDraw Solution Park.
Block diagram
"Project planning is part of project management, which relates to the use of schedules such as Gantt charts to plan and subsequently report progress within the project environment.
Initially, the project scope is defined and the appropriate methods for completing the project are determined. Following this step, the durations for the various tasks necessary to complete the work are listed and grouped into a work breakdown structure. Project planning is often used to organize different areas of a project, including project plans, work loads and the management of teams and individuals. The logical dependencies between tasks are defined using an activity network diagram that enables identification of the critical path. Float or slack time in the schedule can be calculated using project management software. Then the necessary resources can be estimated and costs for each activity can be allocated to each resource, giving the total project cost. At this stage, the project schedule may be optimized to achieve the appropriate balance between resource usage and project duration to comply with the project objectives. Once established and agreed, the project schedule becomes what is known as the baseline schedule. Progress will be measured against the baseline schedule throughout the life of the project. Analyzing progress compared to the baseline schedule is known as earned value management.
The inputs of the project planning phase include the project charter and the concept proposal. The outputs of the project planning phase include the project requirements, the project schedule, and the project management plan." [Project planning. Wikipedia]
The flow chart example "Project planning process" was created using the ConceptDraw PRO diagramming and vector drawing software extended with the Flowcharts solution from the area "What is a Diagram" of ConceptDraw Solution Park.
Flowchart - Project planning process

Process Flowchart


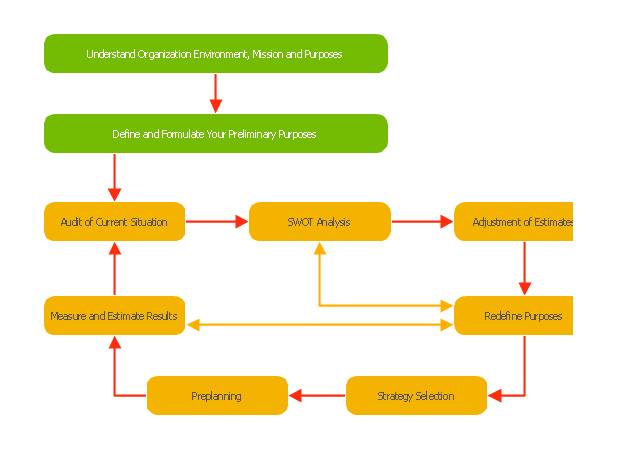
The cycle diagram sample was created on the base of the figure illustrating the webpage "2. POLICY & STRATEGY" of "Scottish Police College Primary Inspection 2006: A Report by Her Majesty's Inspectorate of Constabulary" from the Scottish Government website.
"Strategic Planning.
2.1 The planning process for the College currently follows a structured approach, starting in April and extending through the financial year. The planning cycle is illustrated in figure 2. ...
2.2 The College recognises the need to consult with its customers and stakeholders in the process of setting objectives and directing the training programme. The planning cycle to date refers to force visits, environmental scanning, the course planning process which involves consultation with all forces and other common police services, as well as to a survey of external providers.
2.3 The information from consultation feeds into an EFQM framework from which the College has identified four key policies, namely:
(1) developing and delivering quality training;
(2) developing our people through lifelong learning;
(3) continuous improvement of our service; and
(4) embracing the changing environment.
2.4 The objectives set at divisional level are designed to contribute to delivering these policies. HMIC found that whilst the selected objectives were presented in line with the structure, not all could be considered to meet SMART (Specific, Measurable, Achievable, Relevant and Timed) criteria. This failure indicates that while the process appears suitably structured to deliver a robust result, some of those involved could perhaps have a better understanding of the process." [scotland.gov.uk/ Publications/ 2007/ 02/ 15134652/ 8]
The cycle diagram example "Strategic planning" was created using the ConceptDraw PRO diagramming and vector drawing software extended with the Target and Circular Diagrams solution from the Marketing area of ConceptDraw Solution Park.
www.conceptdraw.com/ solution-park/ marketing-target-and-circular-diagrams
Cycle diagram

Easy Flowchart Program and Standard Flowchart Symbols

 Event-driven Process Chain Diagrams
Event-driven Process Chain (EPC) Diagram is a type of flowchart widely used for modeling in business engineering and reengineering, business process improvement, and analysis. EPC method was developed within the Architecture of Integrated Information Systems (ARIS) framework.
Auditing Process. Audit Planning Process

The Building Blocks Used in EPC Diagrams
")
Modelling Complex Events with Event-Driven Process chain

Graphical Symbols to use in EPC diagrams
")
The Action Plan


EPC - Business Processes in Terms of Work Flows
")
Audit Process Flowchart. Audit Flowchart

TQM Diagram — Professional Total Quality Management

Business Process Modeling with EPC

- Block diagram - Planning process | Project planning process ...
- Block diagram - Planning process | Project planning process ...
- Block diagram - Planning process | Seven Management and ...
- Block diagram - Planning process | Block Diagrams | Block Diagram ...
- Block diagram - Planning process | ConceptDraw Solution Park ...
- Block diagram - Planning process | UML Block Diagram | Process ...
- Block diagram - Planning process | Process Flowchart | Office ...
- Block diagram - Planning process | Block Diagrams | Process ...
- Block diagram - Planning process | The Action Plan | How To use ...
- Block diagram - Planning process | Block Diagrams | Block diagram ...
- Production Planning Process Flowchart
- Project planning diagram | Project planning process - Flowchart ...
- Planning Process Diagram With Help Of Flow Chart Download
- Software Work Flow Process in Project Management with Diagram ...
- The Organizational Planning Process With Diagram
- Block diagram - Planning process | Block Diagrams | Process ...
- Block diagram - Planning process | How To use House Electrical ...
- Block diagram - Planning process | Create Block Diagram | The ...
- Auditing Process . Audit Planning Process | Audit Steps | Audit ...