 Marketing Diagrams
This solution extends ConceptDraw PRO with samples, templates and library of design elements for drawing the marketing diagrams.
 Venn Diagrams
Venn Diagrams are actively used to illustrate simple set relationships in set theory and probability theory, logic and statistics, mathematics and computer science, linguistics, sociology, and marketing. Venn Diagrams are also often used to visually summarize the status and future viability of a project.
 Line Graphs
How to draw a Line Graph with ease? The Line Graphs solution extends the capabilities of ConceptDraw PRO v10 with professionally designed templates, samples, and a library of vector stencils for drawing perfect Line Graphs.
HelpDesk
How to Draw a Pyramid Diagram in ConceptDraw PRO
Pyramid diagram (triangle diagram) is used to represent data, which have hierarchy and basics. Due to the triangular form of diagram, each pyramid section has a different width. The width of the segment shows the level of its hierarchy. Typically, the top of the pyramid is the data that are more important than the base data. Pyramid scheme can be used to show proportional and hierarchical relationships between some logically related items, such as departments within an organization, or successive elements of any process. This type of diagram is often used in marketing to display hierarchical related data, but it can be used in a variety of situations. ConceptDraw PRO allows you to make a pyramid diagram, quickly and easily using special libraries.
 Pyramid Diagrams
Pyramid Diagrams solution extends ConceptDraw PRO software with templates, samples and library of vector stencils for drawing the marketing pyramid diagrams.
 Basic Diagramming
This solution extends ConceptDraw PRO software with the specific tools you need to easily draw flowcharts, block diagrams, histograms, pie charts, divided bar diagrams, line graphs, circular arrows diagrams, Venn diagrams, bubble diagrams and concept maps
 ConceptDraw Solution Park
ConceptDraw Solution Park collects graphic extensions, examples and learning materials
HelpDesk
How to Draw a Block Diagram in ConceptDraw PRO
Block diagram is a simple chart that use blocks to show some elements or activities, and connectors that show the relationship between neighboring blocks. They are commonly simple, giving an overview of a process without necessarily going into the specifics of implementation. Block diagrams are commonly used to depict a general description of a system and its activity. A most known sample of a block diagram is a flow chart, used in many types of business as a common method of representing repeated processes. Easy and a simple creation, a number of objects and connectors make the block diagram a many-sided tool for various industries. The ability to make block diagrams is delivered by the ConceptDraw Block Diagrams solution.HelpDesk
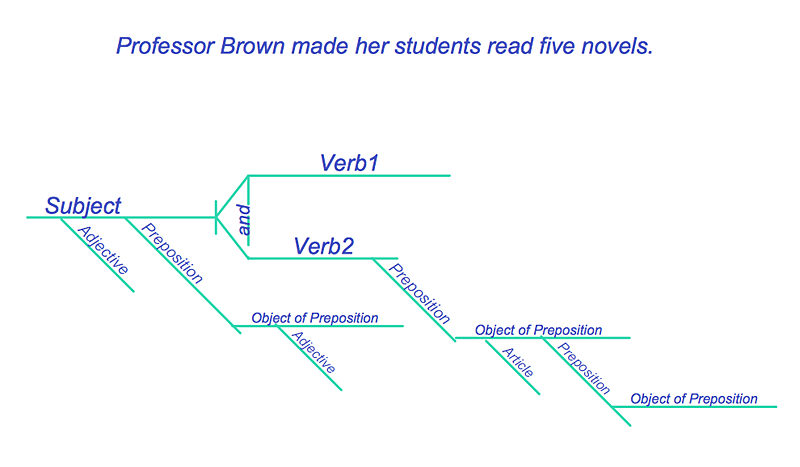
How to Diagram Sentences in ConceptDraw PRO
Diagramming sentences is a playful, fun way to learning English Grammer. Sentences can be very complex, and can contain many different parts of speech which implicate many different grammatical rules. Diagramming sentences will help you to make sure every parts of your sentence are grammatically correct, and provides you with more comprehensive understanding of the English Language. A Sentence Diagram displays the parts of a sentence as a diagram in order to show the relationship of words and groups of words within the sentence. Sentence Diagram shows the relationship between the proposal of its parts. This is a good way to teach grammar! Sentence Diagram helps to make the writing more coherent as well as more interesting to read. ConceptDraw PRO allows you to create clear sentence diagrams using the special templates and vector stencils library.- Line Graphs | Divided Bar Diagrams | Marketing Segmentation Of
- Marketing Diagrams | Flowchart Marketing Process. Flowchart ...
- 3D Network Diagram Software | Basic Diagramming | Pyramid ...
- 3 Level pyramid model diagram - Information systems types
- Pyramid Diagram | Pyramid Diagram | 4 Level pyramid model ...
- Circular diagrams - Vector stencils library | Forces shaping the ...
- Service Marketing Diagram
- Pyramid Diagram | 5 level pyramid model diagram of information ...
- Venn diagram - Path to sustainable development | Matrices | Line ...
- Venn Diagram Template for Word | Multi Layer Venn Diagram . Venn ...
- Circular arrows diagram - Template | Circle-Spoke Diagrams | Circle ...
- 3 Circle Venn Diagram . Venn Diagram Example | 2 Circle Venn ...
- Circle-Spoke Diagrams
- Pyramid Diagram | 3 Level pyramid model diagram - Information ...
- How to Draw a Circular Arrows Diagram Using ConceptDraw PRO ...
- HVAC Plans | Block diagram - Automotive HVAC system | Design ...
- Pyramid Diagram
- 3 Circle Venn. Venn Diagram Example
- Circle Diagrams
- Circular arrows diagram


