Basic Flowchart Symbols and Meaning
Flowcharts are the best for visually representation the business processes and the flow of a custom-order process through various departments within an organization. ConceptDraw PRO diagramming and vector drawing software extended with Flowcharts solution offers the full set of predesigned basic flowchart symbols which are gathered at two libraries: Flowchart and Flowcharts Rapid Draw. Among them are: process, terminator, decision, data, document, display, manual loop, and many other specific symbols. The meaning for each symbol offered by ConceptDraw gives the presentation about their proposed use in professional Flowcharts for business and technical processes, software algorithms, well-developed structures of web sites, Workflow diagrams, Process flow diagram and correlation in developing on-line instructional projects or business process system. Use of ready flow chart symbols in diagrams is incredibly useful - you need simply drag desired from the libraries to your document and arrange them in required order. There are a few serious alternatives to Visio for Mac, one of them is ConceptDraw PRO. It is one of the main contender with the most similar features and capabilities.
How to Build Cloud Computing Diagram Principal Cloud Manufacturing
The term “cloud” is very popular and widely used now, it is a server, data processing centre, or a network which lets to store the data and software, provides access to them, allows to run applications without installation and gives the possibility to process data hosted remotely via the Internet connection. For documenting the Cloud Computing Architecture with a goal to facilitate the communication between stakeholders are successfully used the Cloud Computing Architecture diagrams. It is convenient and easy to draw various Cloud Computing Architecture diagrams in ConceptDraw PRO software with help of tools of the Cloud Computing Diagrams Solution from the Computer and Networks Area of ConceptDraw Solution Park.UML Class Diagram. Design Elements
UML Class Diagrams describes the structure of a system by showing the system's classes, their attributes, and the relationships among the classes.The vector stencils library "Circular diagrams" contains 42 templates of circular diagrams: circular arrow diagram, circular motion diagram, arrow ring chart, doughnut chart (donut chart), circle pie chart, diamond pie chart, circle diagram, pie chart, ring chart, loop diagram, block loop diagram, arrow loop circle, crystal diagram, triangular diagram, diamond diagram, pentagon diagram, hexagon diagram, heptagon diagram, cycle diagram (cycle chart), stacked Venn diagram (onion diagram), arrow circle diagram.
Use these shapes to illustrate your marketing and sales documents, presentations, webpages and infographics in the ConceptDraw PRO diagramming and vector drawing software extended with the Target and Circular Diagrams solution from the Marketing area of ConceptDraw Solution Park.
www.conceptdraw.com/ solution-park/ marketing-target-and-circular-diagrams
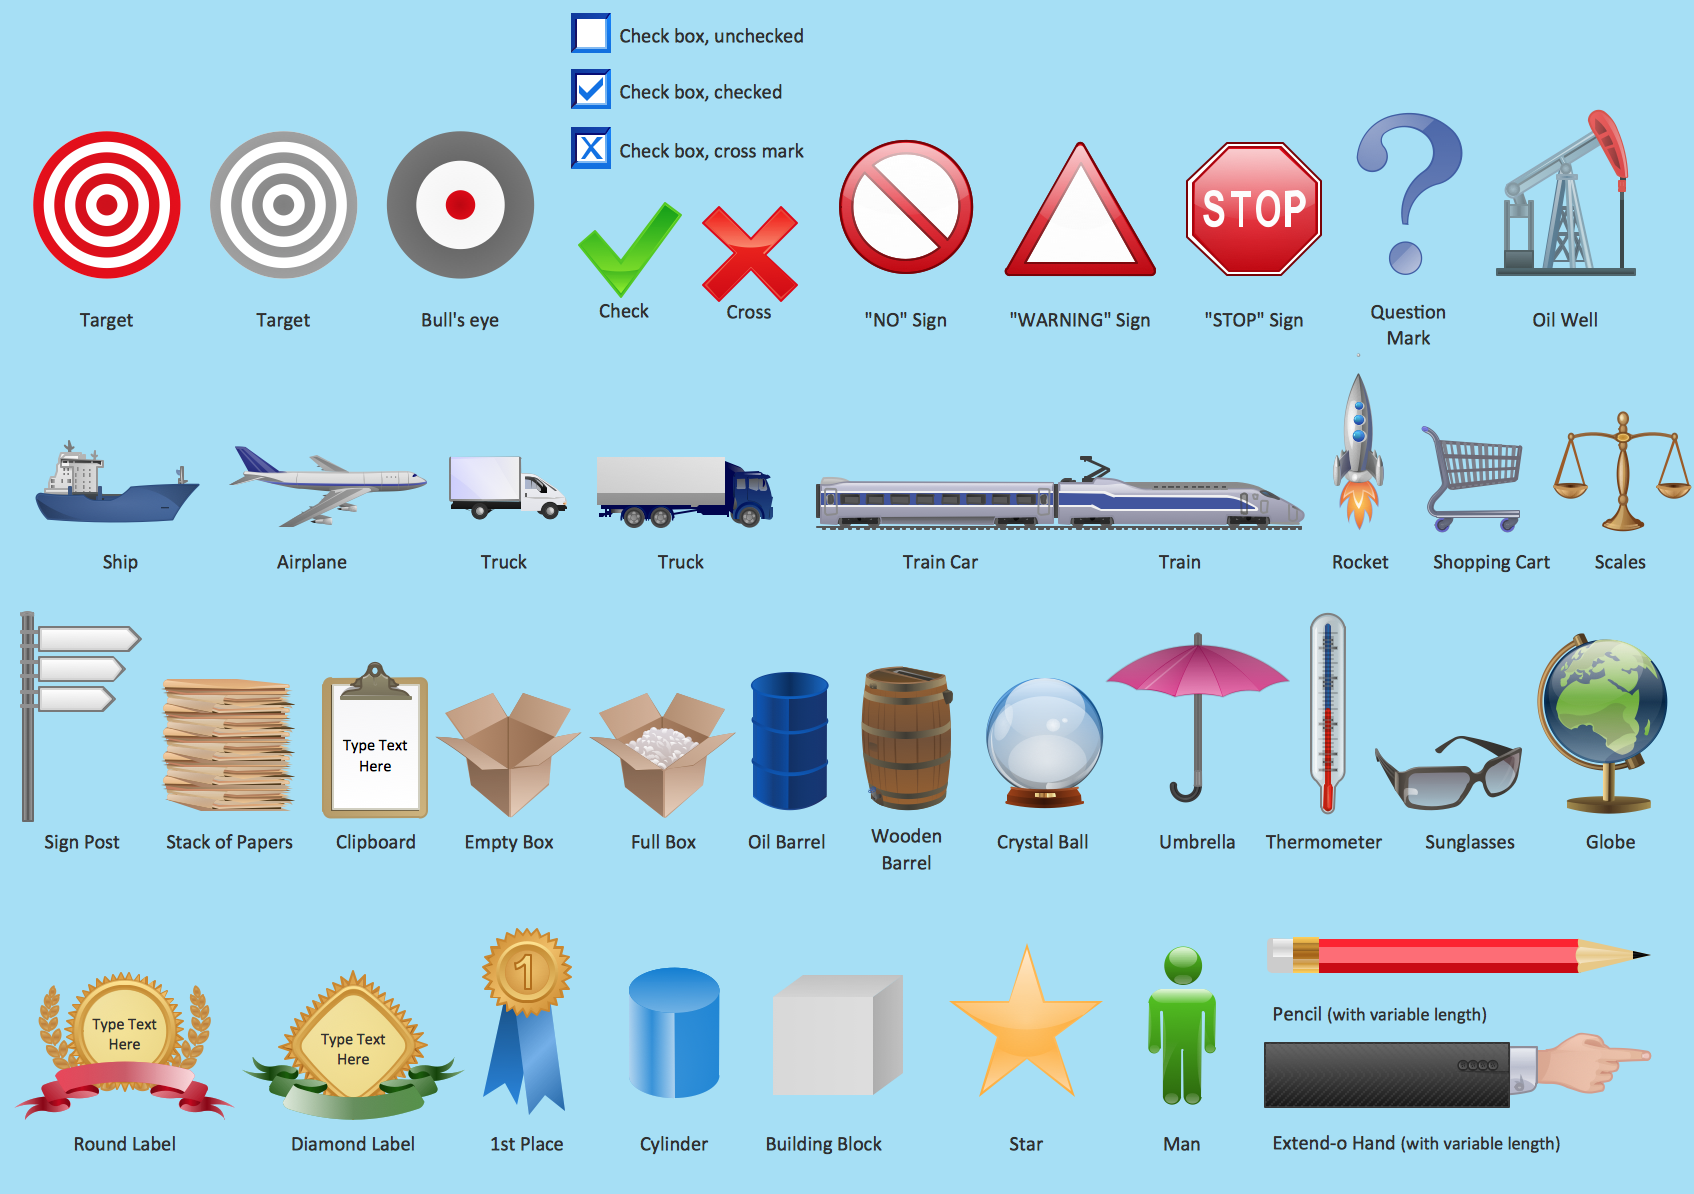
Marketing - Design Elements
If you need to pull together a quick marketing drawing, you'll find elements, samples, templates and libraries with vector clip art for drawing the Marketing Illustrations. These symbols and signs you can use in your design for Strategic Marketing, Graphic Design, Inbound and Content Marketing, Social Media, Lead Generation, Email Marketing and Automation, CRM implementation and Integration and more. This symbols used for marketing presentation, project management report, project management tracking tools and other types of creative project management software.Baseball Diagram – Colored Baseball Field
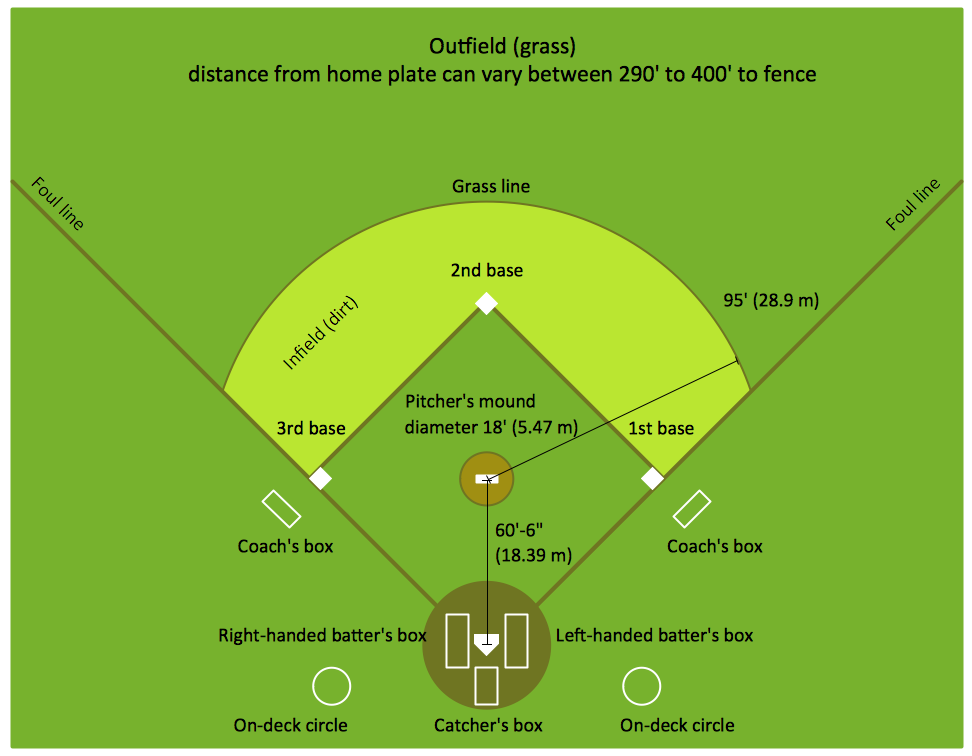
Extending ConceptDraw PRO software with the Baseball solution from the ConceptDraw Solution Park you receive a complete set of libraries, templates and samples allowing to draw baseball diagrams in seconds. You can start from a template, change positions and get ready diagram in some clicks.Basketball Court Diagram and Basketball Positions
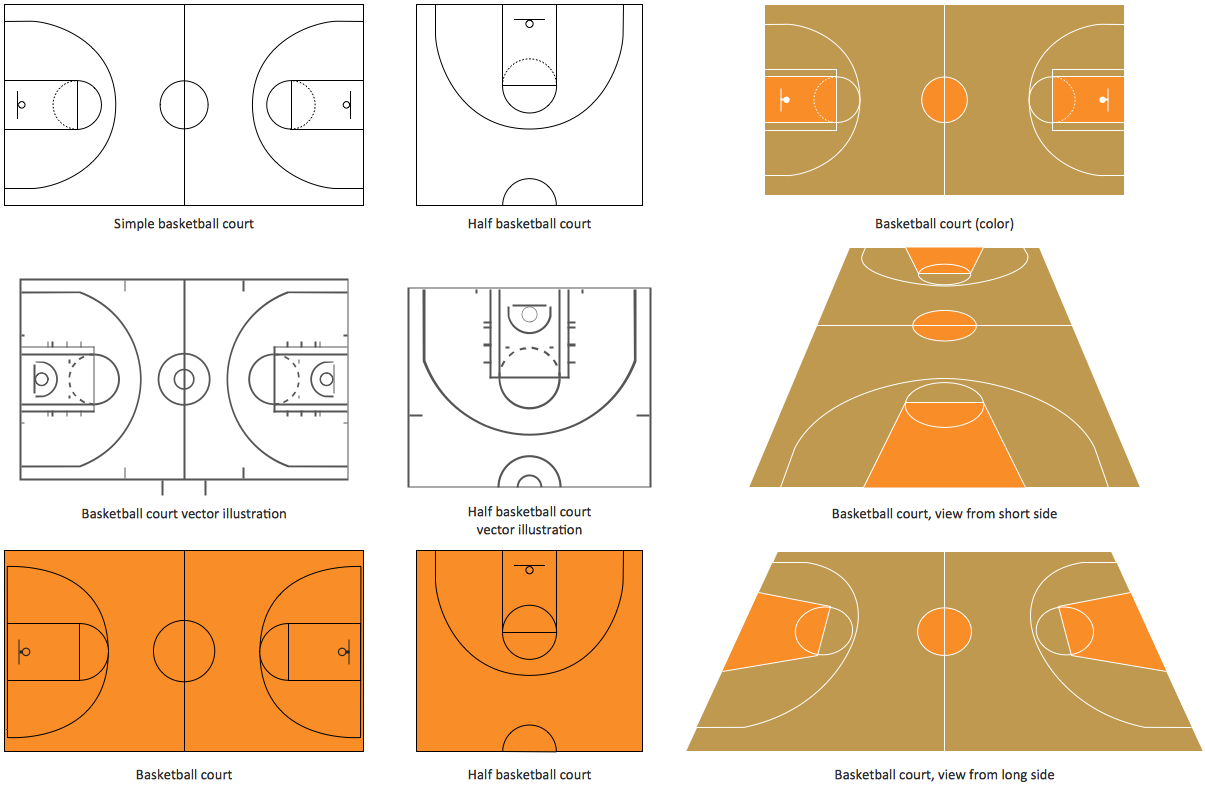
The illustration of possible situations during the basketball matches, presentation of basketball positions and the best tactics, explanation of rules and training to successful game, become much more easier and time saving with visual illustrations and drawings. Creation of several illustrations and comparing them lets effectively show the differences and advantages in positions of players. ConceptDraw PRO software extended with Basketball solution from Sport area of ConceptDraw Solution Park provides the shapes' libraries with different kinds of basketball courts and basketball positions, templates and samples, which will render great help for basketball specialists and fans in drawing professional-looking and illustrative basketball-related diagrams and schematics of any complexity in a few minutes. Extensive export capabilities of ConceptDraw PRO to varied graphical formats open before you wide field for activities and possibility to easy communicate with large quantity of people, which have different software installed on their devices.Baseball Diagram – Baseball Field – Corner View – Template
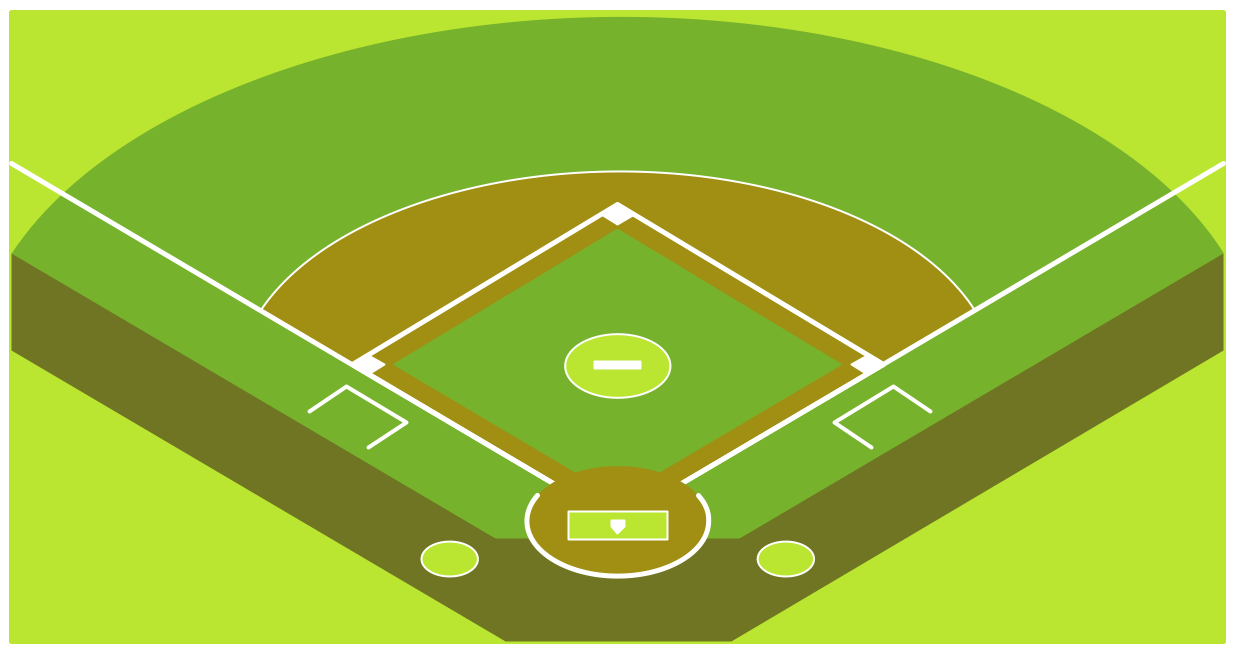
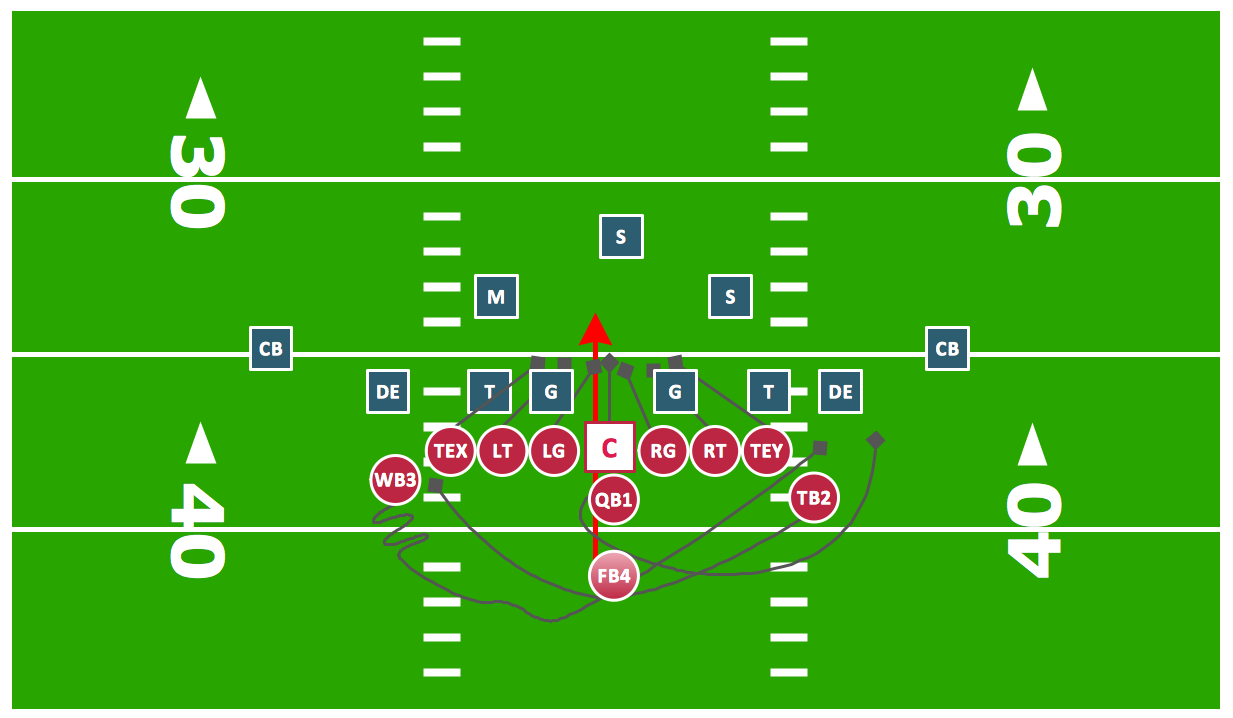
ConceptDraw PRO extended with the Baseball solution provides access to libraries, templates and samples allows creating baseball diagrams and schemas. Fields objects are designed according to real fields dimensions. A set of fields samples includes dimensions. All plays and positions diagrams are available as ready-to-modify samples.Offensive Play – Double Wing Wedge – Vector Graphic Diagram
Producing football diagrams using ConceptDraw PRO software takes seconds, not minutes. Thanks to Football solution from the Sport area of ConceptDraw Solution Park all you need is just drag and drop ready-to-use positions objects to a template contains football field, and place positions on the field.Soccer (Football) Diagram Software
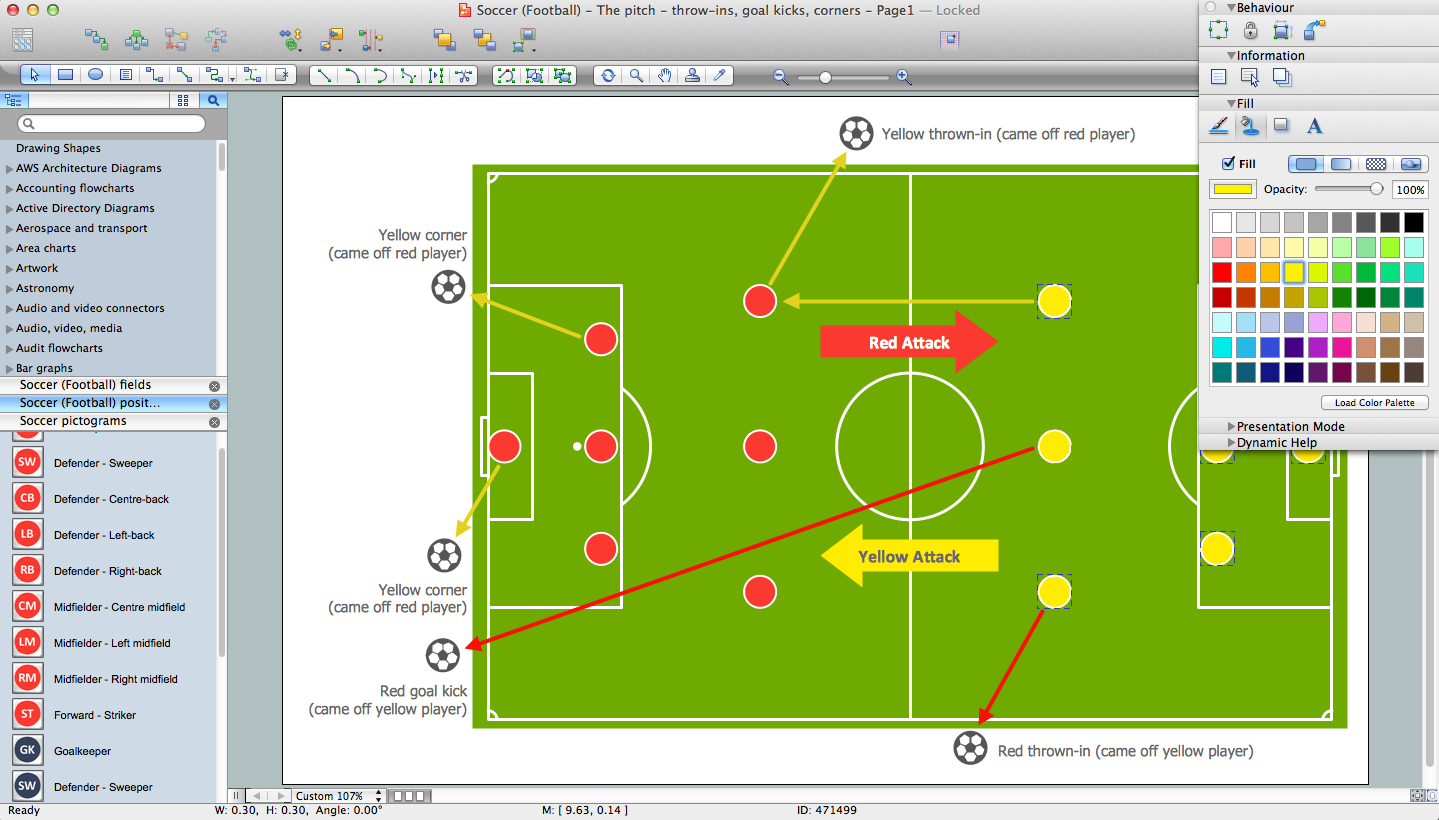
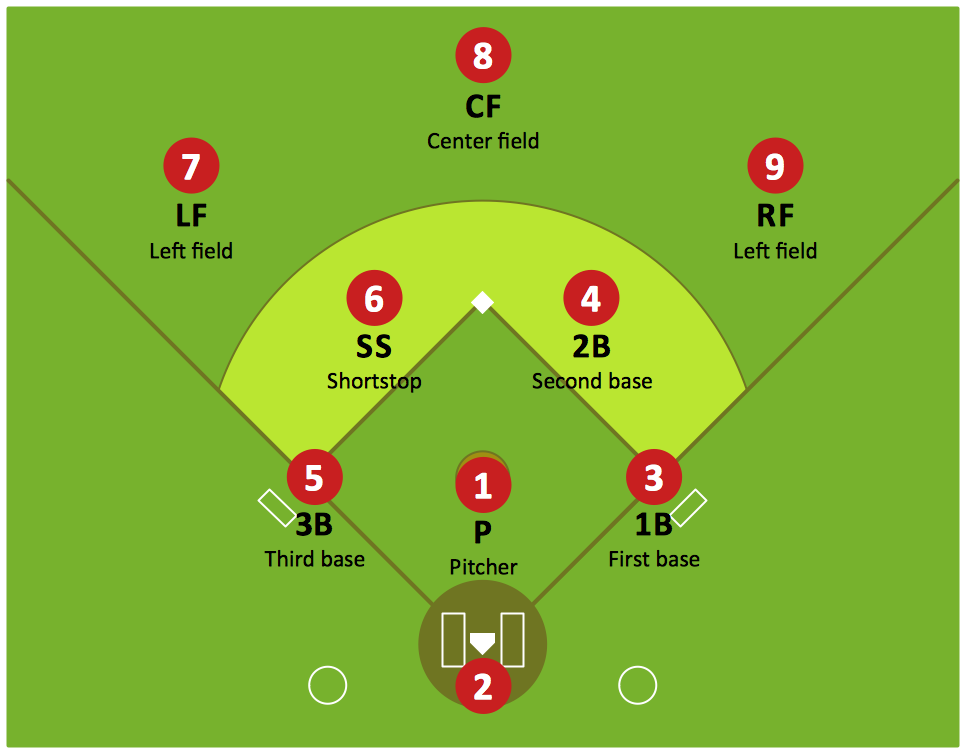
Explaining the soccer strategies and techniques is practically impossible without drawing a diagram. ConceptDraw PRO diagramming and vector drawing software extended with Soccer solution from the Sport area of ConceptDraw Solution Park is a very convenient and useful tool for designing the soccer-related diagrams.Baseball Diagram — Defence Positions
Producing football diagrams using ConceptDraw PRO software takes seconds, not minutes. Thanks to Baseball solution from the Sport area of ConceptDraw Solution Park all you need is just drag and drop ready-to-use positions objects to a template contains baseball field, and place positions on the field.Baseball Diagram – Basic Bunt Coverage – Runner at 1st
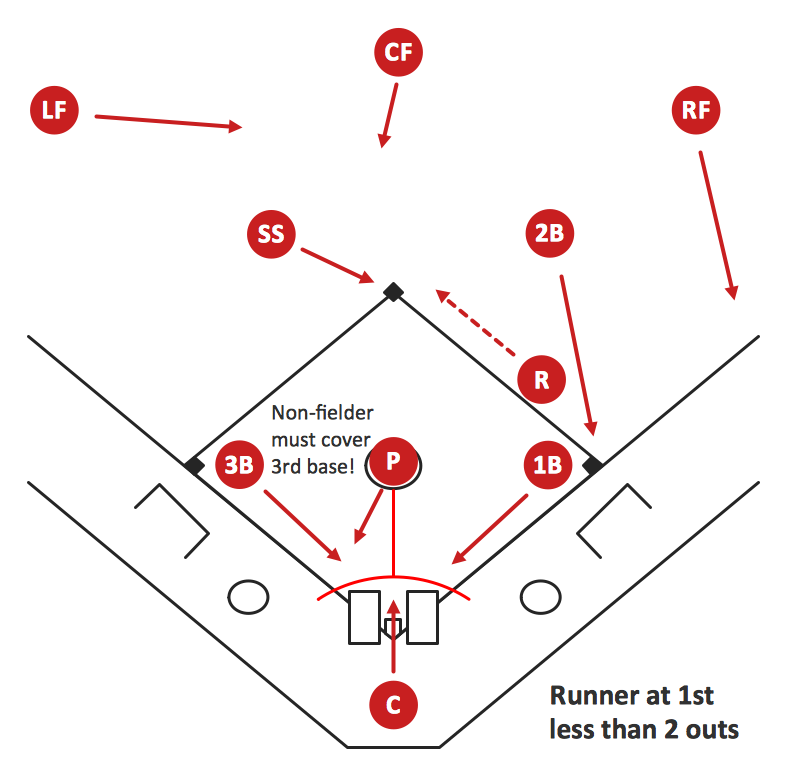
ConceptDraw PRO software extended with the Baseball solution delivers samples with diagrams of the most popular plays in baseball. You can complete this set modifying any sample. All you need is to drag and drop objects to depict another play and then save with the different name. Feel free to add text label with the play name directly to your document.ERD Symbols and Meanings
Entity Relationship Diagram (ERD) is a popular software engineering tool for database modeling and illustration the logical structure of databases, which uses one of two notations - Chen's or Crow’s Foot. Crow's foot notation is effective when used in software engineering, information engineering, structured systems analysis and design. Each of these notations applies its own set of ERD symbols. Crow's foot diagrams use boxes to represent entities and lines between these boxes to show relationships. Varied shapes at the ends of lines depict the cardinality of a given relationship. Chen's ERD notation is more detailed way to represent entities and relationships. ConceptDraw PRO application enhanced with all-inclusive Entity-Relationship Diagram (ERD) solution allows design professional ER diagrams with Chen's or Crow’s Foot notation on your choice. It contains the full set of ready-to-use standardized ERD symbols and meanings helpful for quickly drawing, collection of predesigned ERD samples, examples and templates. ConceptDraw Pro is a great alternative to Visio for Mac users as it offers more features and can easily handle the most demanding professional needs.
- Baseball | Softball Diamond Label
- Baseball | A Label Diagram Of A Softball Pitch
- Baseball | Draw The Diamond Of Softball And Label
- Colored Baseball Field Diagram | Baseball | Baseball Field Sample ...
- Baseball diamond | Baseball Diagram – Baseball Field – Corner ...
- Softball Diamond Diagram
- Simple baseball field | Corner view baseball field | Labeled Softball ...
- Baseball Diagram – Defensive Fly Ball | Baseball Diagram ...
- Selling Concept With Diagram
- Baseball Diagram – Colored Baseball Field | Baseball Diagram ...
- Baseball Diamond Drawing
- How to Create a Venn Diagram in ConceptDraw PRO | Pyramid ...
- UML use case diagram - System of goods selling via catalogues ...
- Marketing - Vector stencils library | Bull Diagram Need Analysis
- Block diagram - Branding strategies | Bar Diagrams for Problem ...
- Online shop - Concept map | UML interaction overview diagram ...
- Target Diagram | ConceptDraw Solution Park | UML Diagram Editor ...
- Six Markets Model Chart | Venn Diagram | Venn Diagram Examples ...
- How to Create a Venn Diagram in ConceptDraw PRO | Marketing ...
- Data flow diagram (DFD) - Payment for goods using UPS code ...


