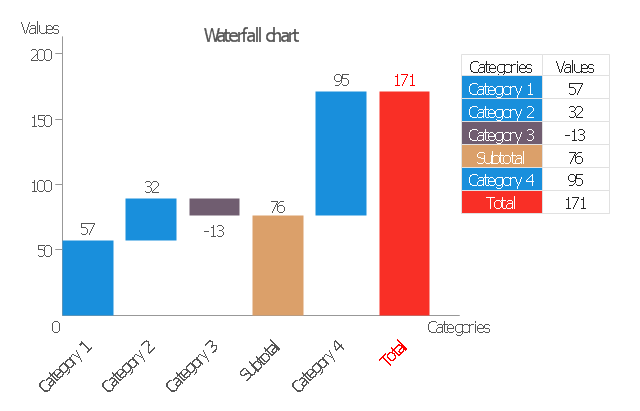
Waterfall Bar Chart
Waterfall chart shows the changing of the value from one state to another through the series of intermediate changes. The waterfall diagrams are widely used in the business. They are used to represent the set of figures and allow link the individual values to the whole.SSADM Diagram
The vector stencils library SSADM from the solution Systems engineering contains specific symbols of SSADM diagrams for ConceptDraw DIAGRAM diagramming and vector drawing software. The Systems engineering solution is contained in Software Development area of ConceptDraw Solution Park. The example below illustrates the waterfall model used in SSADM. This model involves 5 stages of developing a product such as requirements specification and its' analysis, design, coding and testing.OOSE Method
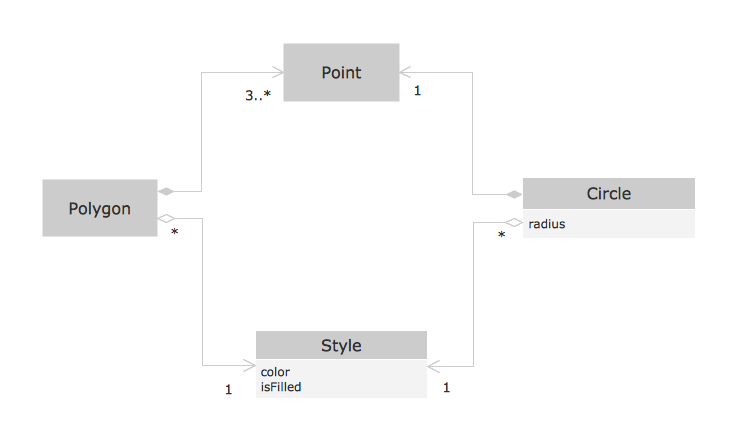
This sample shows the OOSE diagram with aggregation and composition associations. Using the Rapid UML Solution for ConceptDraw DIAGRAM you can create your own professional OOSE Diagrams quick and easy.UML Diagram Visio
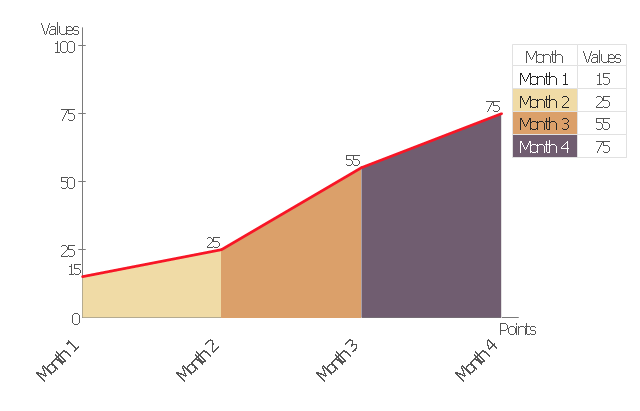
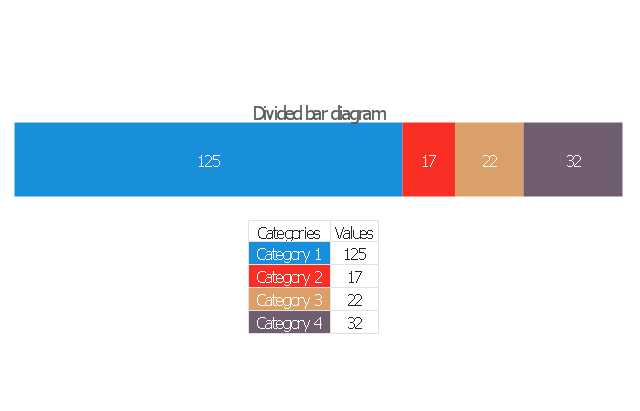
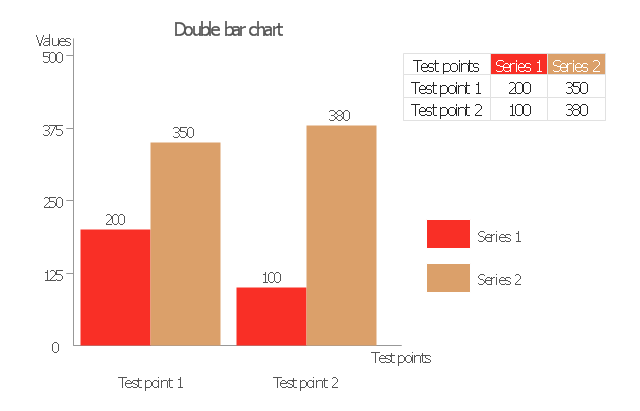
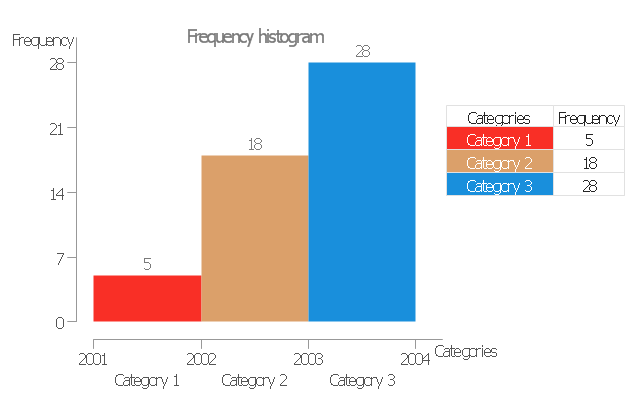
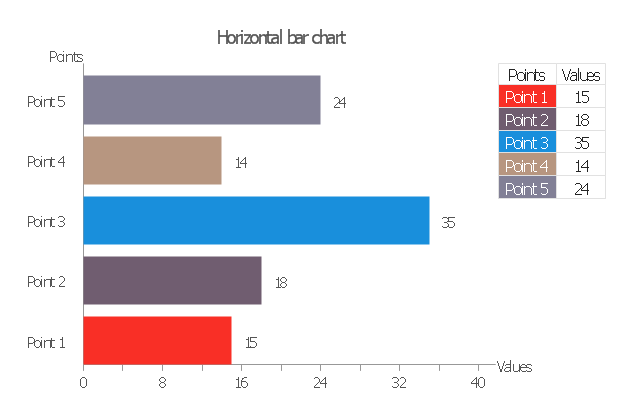
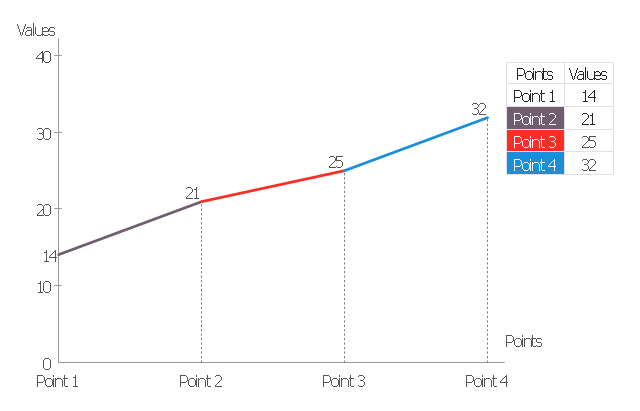
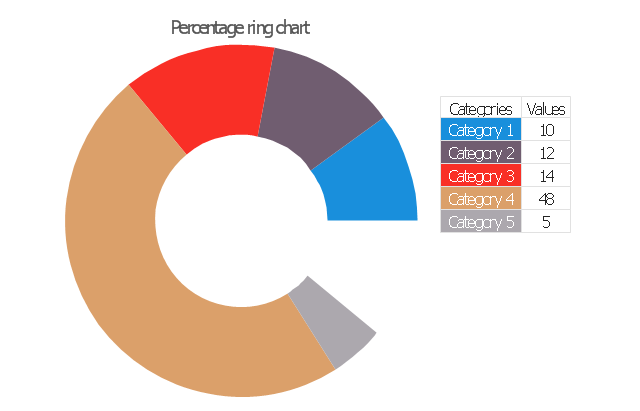
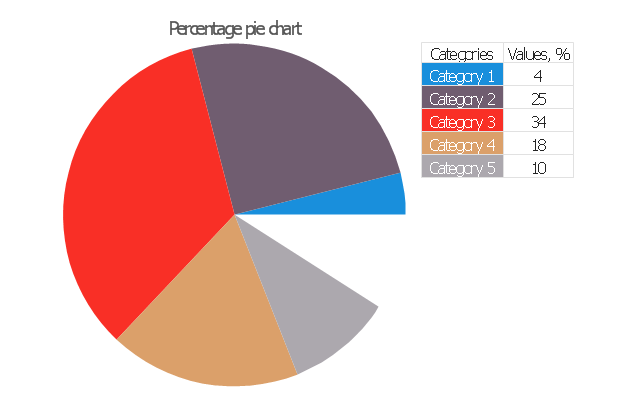
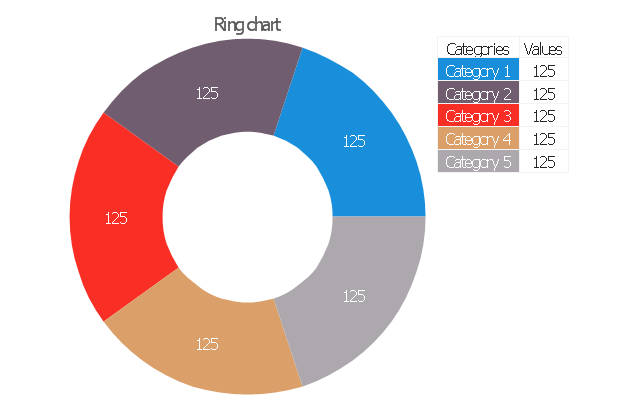
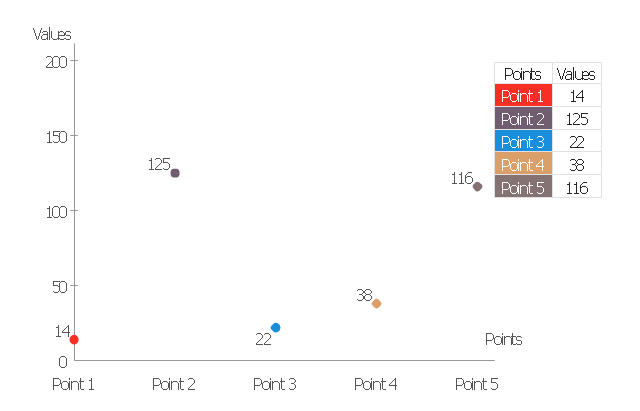
This sample shows the UML Class Diagram that was created in ConceptDraw DIAGRAM on the Mac and then was opened for editing in MS Visio. Using the 13 libraries of the Rapid UML Solution for ConceptDraw DIAGRAM you can create your own visual vector UML diagrams quick and easy.The vector stencils library "Data-driven charts" contains 13 data-driven graphs and charts: area chart, divided bar diagram, double bar graph, frequency histogram, horizontal bar chart, line graph, percentage ring chart, percentage pie chart, scatter plot, column chart, waterfall chart.
Use it to visualize quantitative data in your data-driven infographics.
The graphs example "Data-driven charts - Vector stencils library" was created using the ConceptDraw PRO diagramming and vector graphics software extended with the Data-driven Infographics solution from the area "What is infographics" of ConceptDraw Solution Park.
How to Create a Bar Chart
The answer how to create a bar chart can be found in ConceptDraw software. The simple tips guide you through the software to quickly learn how to create a bar chart.Example Process Flow
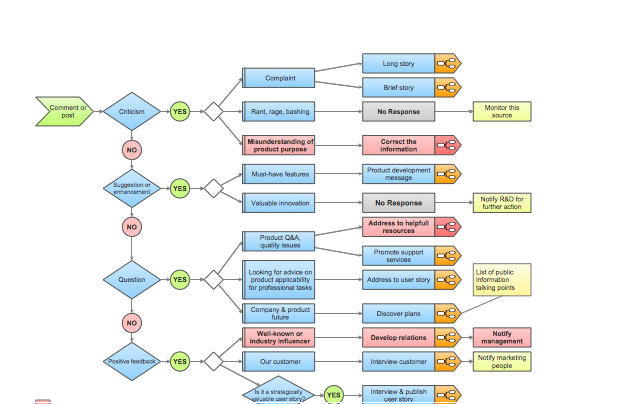
A flowchart is a picture of the separate steps of a process in sequential order. ConceptDraw DIAGRAM is a Process Flowcharts software. This software includes basic package of process flow examples. The software contains object libraries with vector stencils that allows you use RapidDraw technology. By clicking on direction arrows you can add a new object to the flowchart.- ConceptDraw PRO DFD Software | Waterfall Model Dfd
- ConceptDraw PRO DFD Software | Waterfall Model Of The Ssadm
- Best Software to Draw Diagrams | Waterfall Bar Chart | Chart Maker ...
- SSADM Diagram | Waterfall Bar Chart | Best Program to Make ...
- Bar Chart Template for Word | Waterfall Bar Chart | Column Chart ...
- Waterfall Bar Chart | SSADM Diagram | Network Topology Graphical ...
- Pie Chart Software | Waterfall Bar Chart | Flow chart Example ...
- Waterfall Bar Chart | Geography - Vector stencils library | SSADM ...
- Waterfall Model For Library Management System Ppt
- Examples for OOSE Method | OOSE Method | Waterfall Bar Chart ...




-data-driven-charts---vector-stencils-library.png--diagram-flowchart-example.png)
