HelpDesk
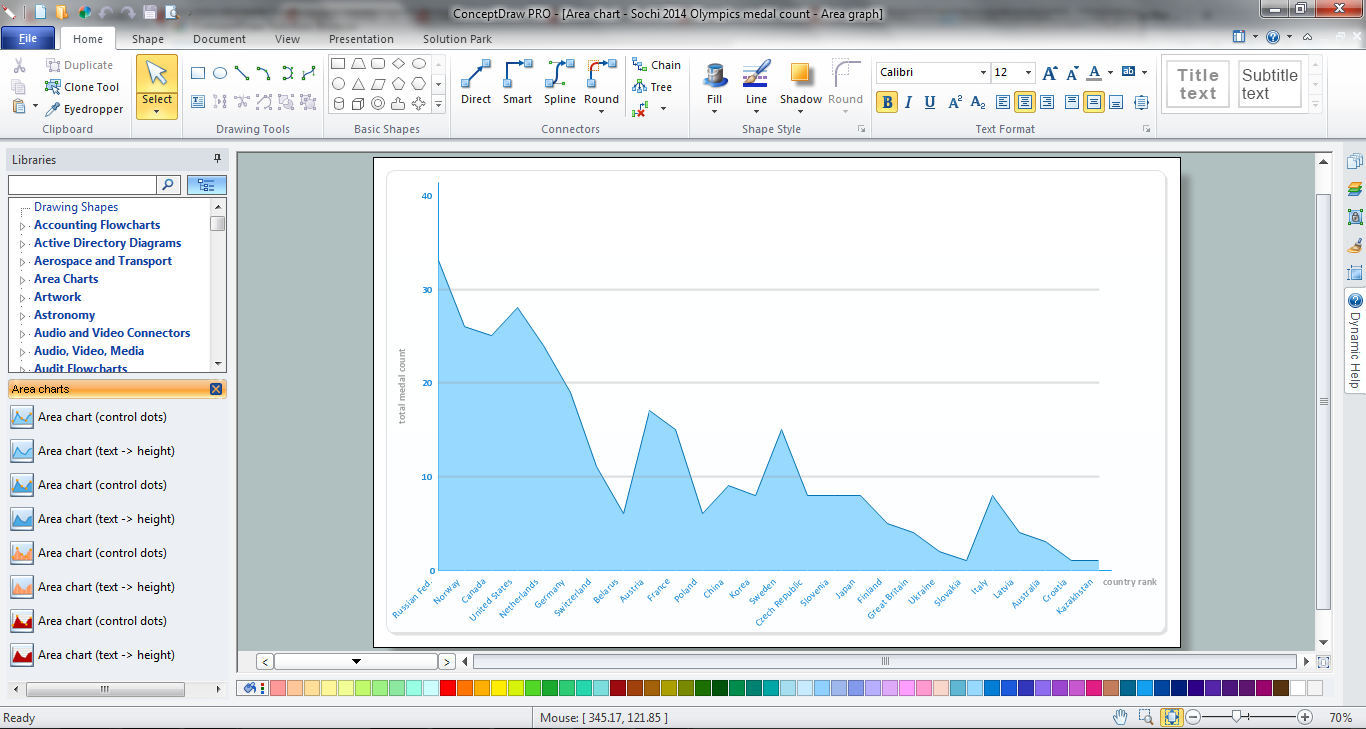
How to Draw an Area Chart

Area Chart
 Basic Area Charts
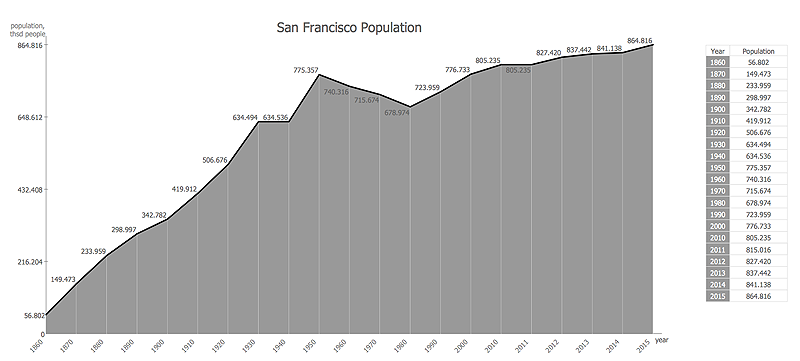
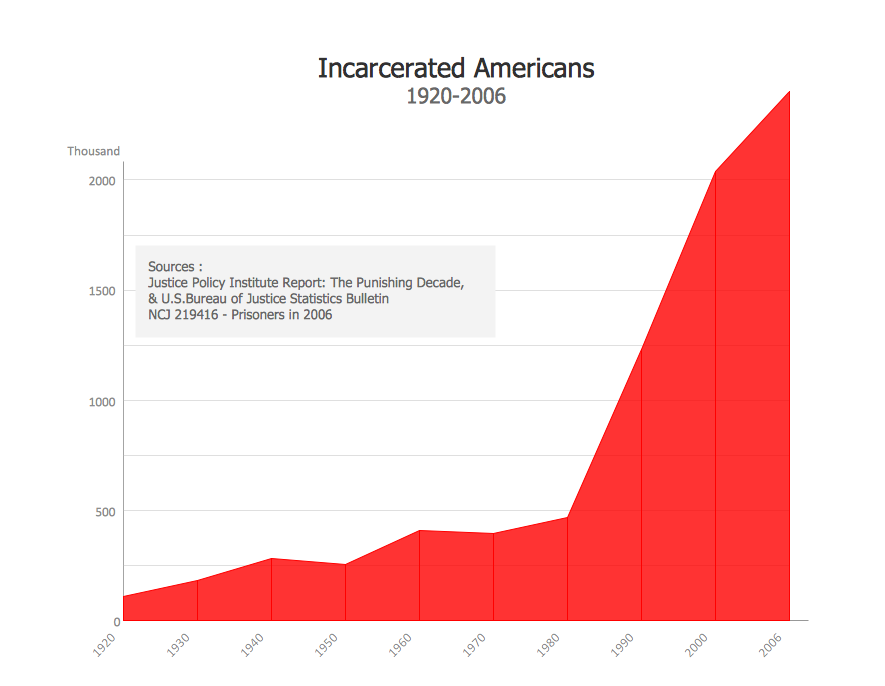
This solution extends the capabilities of ConceptDraw DIAGRAM (or later) with templates, samples and a library of vector stencils for drawing Area Charts (area graphs) that visualize changes in values by filling in the area beneath the line connecting data points.
 Area Charts
Area Charts are used to display the cumulative totals over time using numbers or percentages; or to show trends over time among related attributes. The Area Chart is effective when comparing two or more quantities. Each series of data is typically represented with a different color, the use of color transparency in an object’s transparency shows overlapped areas and smaller areas hidden behind larger areas.
HelpDesk
How to Create a Basic Diagram with ConceptDraw DIAGRAM
Area Charts
Basic Diagramming


Chart Software for Better Presentations

Simple Diagramming

The Best Drawing Program for Mac

- Basic Diagramming | Line Chart Examples | Area Chart | An Easy ...
- Basic Diagramming | Area Chart | Create Graphs and Charts ...
- Education Package | Circle-Spoke Diagrams | Basic Area Charts ...
- UML Use Case Diagram Example Registration System | Area Charts ...
- How to Draw an Area Chart in ConceptDraw PRO | Area Charts ...
- Area Charts | Use Case Diagram For College Admission System
- Process Flowchart | Area Charts | Data Flow Diagram College ...
- Winter Sports | Area Charts | Basic Area Charts | Oyampics Er Diagram
- Basic Diagramming | Basic Area Charts | Picture Graphs | Block ...
- Process Flowchart | Area Charts | How to Draw an Area Chart in ...