Professional Diagrams - No need for any special drawing skills for you
No need for any special drawing skills to create professional looking diagrams outside of your knowledge base. ConceptDraw PRO takes care of the technical side. Use templates, samples and special libraries for your needs.Process Flowchart
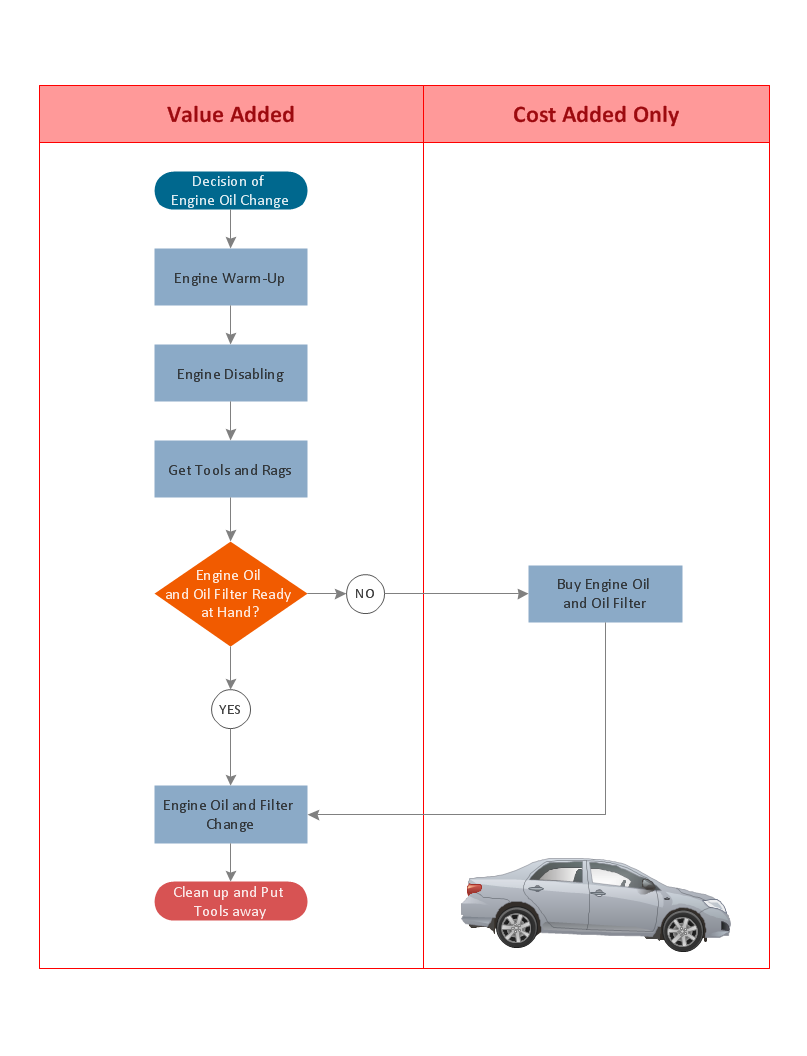
The main reason of using Process Flowchart or PFD is to show relations between major parts of the system. Process Flowcharts are used in process engineering and chemical industry where there is a requirement of depicting relationships between major components only and not include minor parts. Process Flowcharts for single unit or multiple units differ in their structure and implementation. ConceptDraw PRO is Professional business process mapping software for making Process flowcharts, Process flow diagram, Workflow diagram, flowcharts and technical illustrations for business documents and also comprehensive visio for mac application. Easier define and document basic work and data flows, financial, production and quality management processes to increase efficiency of your business with ConcepDraw PRO. Business process mapping software with Flowchart Maker ConceptDraw PRO includes extensive drawing tools, rich examples and templates, process flowchart symbols and shape libraries, smart connectors that allow you create the flowcharts of complex processes, process flow diagrams, procedures and information exchange. Process Flowchart Solution is project management workflow tools which is part ConceptDraw Project marketing project management software. Drawing charts, diagrams, and network layouts has long been the monopoly of Microsoft Visio, making Mac users to struggle when needing such visio alternative like visio for mac, it requires only to view features, make a minor edit to, or print a diagram or chart. Thankfully to MS Visio alternative like ConceptDraw PRO software, this is cross-platform charting and business process management tool, now visio alternative for making sort of visio diagram is not a problem anymore however many people still name it business process visio tools.
HelpDesk
How to Create a Timeline Diagram in ConceptDraw PRO
A Timeline is a chart which displays a project plan schedule in chronological order. A Timeline is used in project management to depict project milestones and visualize project phases, and show project progress. The graphic form of a timeline makes it easy to understand critical project milestones, such as the progress of a project schedule. Timelines are particularly useful for project scheduling or project management when accompanied with a Gantt chart. It captures the main of what the project will accomplish and how it will be done. making a project timeline is one of the most important skills a project manager needs have. Making comprehensive, accurate timelines allows you getting every project off in the best way. ConceptDraw PRO allows you to draw a timeline charts using special library.TQM Tools
ConceptDraw PRO diagramming and vector drawing software enhanced with Total Quality Management (TQM) Diagrams solution from the Quality area of ConceptDraw Solution Park is rich for the useful and effective TQM tools.Basketball Court Diagram and Basketball Positions
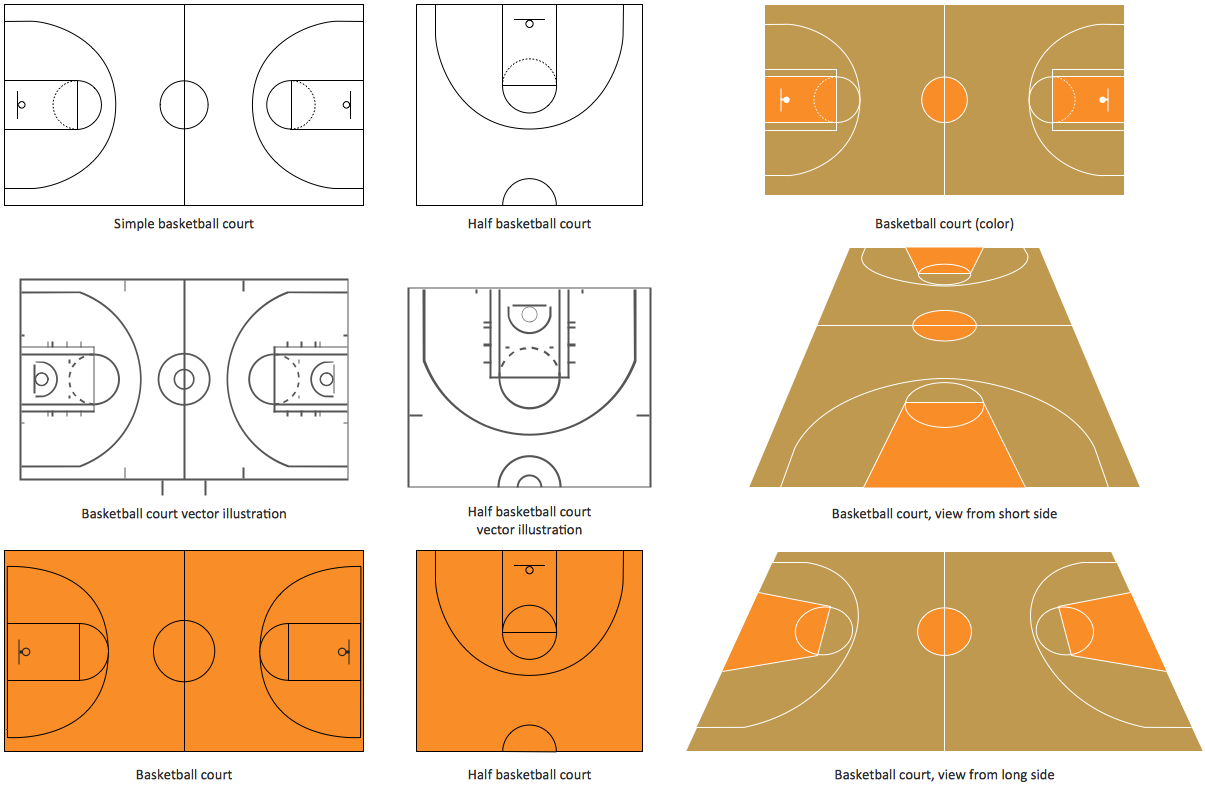
The illustration of possible situations during the basketball matches, presentation of basketball positions and the best tactics, explanation of rules and training to successful game, become much more easier and time saving with visual illustrations and drawings. Creation of several illustrations and comparing them lets effectively show the differences and advantages in positions of players. ConceptDraw PRO software extended with Basketball solution from Sport area of ConceptDraw Solution Park provides the shapes' libraries with different kinds of basketball courts and basketball positions, templates and samples, which will render great help for basketball specialists and fans in drawing professional-looking and illustrative basketball-related diagrams and schematics of any complexity in a few minutes. Extensive export capabilities of ConceptDraw PRO to varied graphical formats open before you wide field for activities and possibility to easy communicate with large quantity of people, which have different software installed on their devices.Powerful Drawing Feature for Creating Professional Diagrams
This will let you create professional diagrams and charts using its simple RapidDraw option just in clicks. Take a look on a diagram you are looking for and create it fast and quickly.MS Visio Look a Like Diagrams
No need for any special drawing skills to create professional looking diagrams outside of your knowledge base. ConceptDraw PRO takes care of the technical details, allowing you to focus on your job, not the drawing. ConceptDraw PRO delivers full-functioned alternative to MS Visio. ConceptDraw PRO supports import of Visio files. ConceptDraw PRO supports flowcharting, swimlane, orgchart, project chart, mind map, decision tree, cause and effect, charts and graphs, and many other diagram types.
 Venn Diagrams
Venn Diagrams are actively used to illustrate simple set relationships in set theory and probability theory, logic and statistics, mathematics and computer science, linguistics, sociology, and marketing. Venn Diagrams are also often used to visually summarize the status and future viability of a project.
HelpDesk
How to Manage Problem Solving Using Seven Management and Planning Tools
Stage by stage gouide on using visual tools to move toward solving the problem.
Create Professional Looking Diagrams
No need for any special drawing skills to create professional looking diagrams outside of your knowledge base. ConceptDraw PRO takes care of the technical details, allowing you to focus on your job, not the drawing.Fault Tree Diagram
ConceptDraw PRO diagramming and vector drawing software offers the Fault Tree Analysis Diagrams Solution from the Industrial Engineering Area of ConceptDraw Solution Park for quick and easy creating the Fault Tree Diagram of any degree of detailing.Activity Network (PERT) Chart
Activity Network and Project Evaluation and Review Technique, or PERT, charts are a way of documenting and analyzing the tasks in a project. This diagram is constructed as part of the process in creating a schedule of corrective actions. The Activity Network Chart (PERT) shows the logical connections and consequence of tasks to be performed. It displays the time period for problem solving and the implementation of all activities through the critical path.ConceptDraw Arrows10 Technology
Imagine the diagram which is looking smart. That is how ConceptDraw Arrows10 Technology or Smart connectors work. Thanks to auto-routing feature connectors flow around objects. But if you want some background objects that the connectors flow through - that is also possible to do.Graphical Symbols to use in EPC diagrams
Event-Driven Process Chain Diagrams for improvement throughout an organisation. ConceptDraw PRO - software that reduces the time needed to create a business process model.- Diagram On Managerial Skills
- Project — Assigning Resources | Project management skills ...
- Project management skills diagram
- What Is Management With Diagram
- Diagram Of It Project Management
- Human Resource Development | Best Program to Make Diagrams ...
- Diagrams Of Managerial Skills
- Managerial Skills Planning Flow Chart
- Draw Management Skills
- Cause and Effect Analysis | Process Flowchart | Skills Needed For ...
- Pyramid Diagram | Simple & Fast Diagram Software | PM Response ...
- Project Management Matrix
- Diagram Representing The Project Management Phases
- Skill Matrix Flow Chart
- Diagram And Flow Chart Of Organization Development Skills
- Pyramid Diagram | Pyramid Diagram | Project management triangle ...
- Entity Relationship Diagram Software Engineering | HR ...
- Entity Relationship Diagram Software Engineering | Business ...
- Pyramid Diagram | Project management triangle diagram | Pyramid ...
- Professional Diagrams - No need for any special drawing skills for you


.png)


