 Target and Circular Diagrams
This solution extends ConceptDraw PRO software with samples, templates and library of design elements for drawing the Target and Circular Diagrams.
This flow chart sample was drawn on the base on the illustration of the article "Climate change impact on China food security in 2050" from the website of Chinese Academy of Agricultural Sciences .
[caas.cn/ en/ newsroom/ research_ update/ 67347.shtml]
"Food security is a condition related to the ongoing availability of food. ...
According to the Food and Agriculture Organization (FAO), food security "exists when all people, at all times, have physical and economic access to sufficient, safe and nutritious food to meet their dietary needs and food preferences for an active and healthy life". ...
Extreme events, such as droughts and floods, are forecast to increase as climate change takes hold. Ranging from overnight floods to gradually worsening droughts, these will have a range of impacts on the agricultural sector. ...
According to the Climate & Development Knowledge Network report Managing Climate Extremes and Disasters in the Agriculture Sectors: Lessons from the IPCC SREX Report, the impacts will include changing productivity and livelihood patterns, economic losses, and impacts on infrastructure, markets and food security. Food security in future will be linked to our ability to adapt agricultural systems to extreme events." [Food security. Wikipedia]
The flowchart example "Food security assessment" was created using the ConceptDraw PRO diagramming and vector drawing software extended with the Flowcharts solution from the area "What is a Diagram" of ConceptDraw Solution Park.
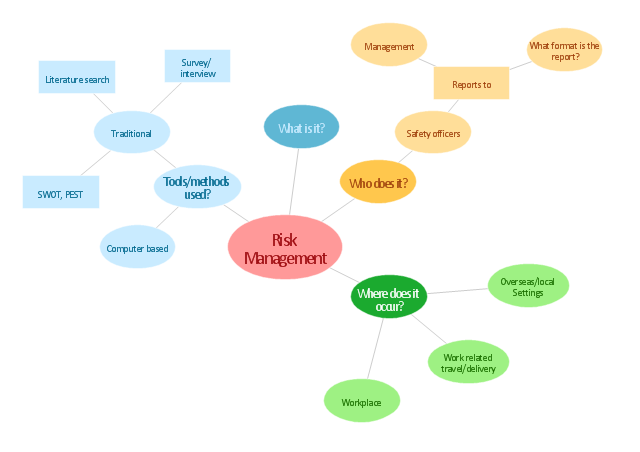
"Risk management is the identification, assessment, and prioritization of risks (defined in ISO 31000 as the effect of uncertainty on objectives, whether positive or negative) followed by coordinated and economical application of resources to minimize, monitor, and control the probability and/ or impact of unfortunate events or to maximize the realization of opportunities. Risks can come from uncertainty in financial markets, threats from project failures (at any phase in design, development, production, or sustainment life-cycles), legal liabilities, credit risk, accidents, natural causes and disasters as well as deliberate attack from an adversary, or events of uncertain or unpredictable root-cause. ... Methods, definitions and goals vary widely according to whether the risk management method is in the context of project management, security, engineering, industrial processes, financial portfolios, actuarial assessments, or public health and safety.
The strategies to manage threats (uncertainties with negative consequences) typically include transferring the threat to another party, avoiding the threat, reducing the negative effect or probability of the threat, or even accepting some or all of the potential or actual consequences of a particular threat, and the opposites for opportunities (uncertain future states with benefits)." [Risk management. Wikipedia]
The concept map example "Risk management" was created using the ConceptDraw PRO diagramming and vector drawing software extended with the Concept Maps solution from the area "What is a Diagram" of ConceptDraw Solution Park.
- Diagram Of Marketing Of Services
- Leaky bucket diagram | Six Markets Model Chart | Pyramid Diagram ...
- Circle Spoke Diagram Template | Program assessment plan - Arrow ...
- Lifecycle of an award - Circle diagram | Program assessment plan ...
- Target Diagram | Target diagrams - Vector stencils library | Target ...
- SWOT Analysis Solution - Strategy Tools | TOWS analysis matrix ...
- How to Create SWOT Analysis Template Using ConceptDraw PRO ...
- Competitive strategy matrix - Template | SWOT Analysis Solution ...
- SWOT Analysis | Software for Creating SWOT Analysis Diagrams ...
- SWOT analysis diagram - Template | SWOT Sample in Computers ...
- SWOT analysis for a small independent bookstore | SWOT Analysis ...
- SWOT analysis matrix diagram templates | SWOT Matrix | Software ...
- Porter's value chain diagram - Template
- What is SWOT Analysis in Marketing | What is SWOT Analysis ...
- Matrices | Matrices | Design elements - Matrices | Matrices
- PROBLEM ANALYSIS . Root Cause Analysis Tree Diagram | Coad ...
- Circle Diagrams | What Is a Circle Spoke Diagram | Basic Flowchart ...
- Competitive Assessment Matrix
- Circle-spoke diagram - Target market | Target market - Onion ...
- Services Marketing In Diagram

