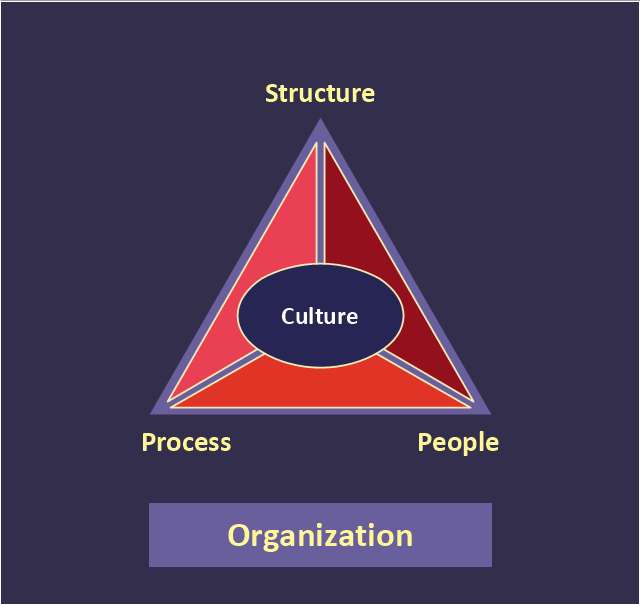
"At the base of the identity of an organisational is its organizational culture. A culture is comprised of the shared values, customs, traditions, rituals, behaviours and beliefs shared by a social group (national, ethnic, organizational, etc.). Cultures also share languages, or ways of speaking. From a communication perspective, cultures are made and remade through the words we use to describe our world. Culture represents a common set of values (“shared meanings”), shared by members of a population, a organization, a project/ programme purpose unit or a profession (e.g., engineers versus scientists). Culture change with the times but the speed at which the culture of different institutions change varies widely." [Development Cooperation Handbook/ The development aid organization/ Organizational Culture. Wikibooks]
This organizational culture triangle diagram example derived from Parker and Benson's model. It's for explaination of the Regatta: Adoption Method.
The pyramid diagram example "Organizational culture" was redesigned using the ConceptDraw PRO diagramming and vector drawing software from Wikimedia Commons file Organization_ Triangle.png. [commons.wikimedia.org/ wiki/ File:Organization_ Triangle.png]
This file is licensed under the Creative Commons Attribution-Share Alike 2.5 Generic license. [creativecommons.org/ licenses/ by-sa/ 2.5/ deed.en]
The triangular chart sample "Organizational culture" is included in the Pyramid Diagrams solution from the Marketing area of ConceptDraw Solution Park.
Pyramid Diagram
At the base of the identity of an organisational is its organizational culture.Matrix Organization Structure
Matrix organizational structure is one of the main forms of structures which is actively used by organizations to carry forth the functions of a company visually and effectively. Now we have ConceptDraw PRO diagramming and vector drawing software extended with 25 Typical Orgcharts solution from the Management area of ConceptDraw Solution Park which will help easy represent matrix organizational structure of any degree of complexity.Process Flowchart
The main reason of using Process Flowchart or PFD is to show relations between major parts of the system. Process Flowcharts are used in process engineering and chemical industry where there is a requirement of depicting relationships between major components only and not include minor parts. Process Flowcharts for single unit or multiple units differ in their structure and implementation. ConceptDraw PRO is Professional business process mapping software for making Process flowcharts, Process flow diagram, Workflow diagram, flowcharts and technical illustrations for business documents and also comprehensive visio for mac application. Easier define and document basic work and data flows, financial, production and quality management processes to increase efficiency of your business with ConcepDraw PRO. Business process mapping software with Flowchart Maker ConceptDraw PRO includes extensive drawing tools, rich examples and templates, process flowchart symbols and shape libraries, smart connectors that allow you create the flowcharts of complex processes, process flow diagrams, procedures and information exchange. Process Flowchart Solution is project management workflow tools which is part ConceptDraw Project marketing project management software. Drawing charts, diagrams, and network layouts has long been the monopoly of Microsoft Visio, making Mac users to struggle when needing such visio alternative like visio for mac, it requires only to view features, make a minor edit to, or print a diagram or chart. Thankfully to MS Visio alternative like ConceptDraw PRO software, this is cross-platform charting and business process management tool, now visio alternative for making sort of visio diagram is not a problem anymore however many people still name it business process visio tools.
Pyramid Diagram
Zooko's triangle is a diagram named after Zooko Wilcox-O'Hearn which sets out suspected tradeoffs for a system for giving names to participants in a network protocol.Pyramid Diagram
Pyramid diagrams help you visualize information as a triangle divided into horizontal slices. Labelled slices represent a hierarchy. Pyramids are used in marketing presentations to show and analyze hierarchy levels. 3D triangular diagram of DIKW pyramid has 6 levels: measurement, facts, data, information, knowledge, wisdom. The data component include different scattered signs or symbols which are merely useless until these random objective facts are somehow processed. Data is a resource which has to be manipulated or rearranged to get useful. Information can be extracted from a pile of data, it also can be mined from different data storages.How to Create a Pyramid Diagram
ConceptDraw Pyramid Diagram software allows drawing column charts using predesigned objects or drawing tools. In ConceptDraw Pyramid Diagram software you can find a complete set of column chart tools and objects.Total Quality Management Business Diagram
The Total Quality Management Diagram solution helps you and your organization visualize business and industrial processes. Create Total Quality Management diagrams for business process with ConceptDraw software.Value Stream Mapping Symbols
VSM symbols are the best for a production process designing. The entire Value Stream Mapping method uses a graphical representation of the manufacturing process, factors' pros and cons, that all stakeholders can easily understand. Value Stream Mapping is a graphical technique that provides possibilities to improve analysis of a manufacturing process, at the stage of the transferring information or materials that required to deliver a product or service to the customer.Identifying Quality Management System
The Total Quality Management Diagram solution helps your organization visualize business and industrial processes. Create Total Quality Management diagrams for business process with ConceptDraw software.What is a Quality Management
Successful quality management implemented in a company of any size is a critical component of a company organization.Competitor Analysis
Competitor analysis is a first and obligatory step in elaboration the proper corporate marketing strategy and creating sustainable competitive advantage. Use powerful opportunities of numerous solutions from ConceptDraw Solution Park for designing illustrative diagrams, charts, matrices which are necessary for effective competitor analysis.A Study of the Business Value of Total Quality Management
The Total Quality Management Diagram solution helps your organization visualize business and industrial processes. Create Total Quality Management diagrams for business process with ConceptDraw software.Mind Maps for Business - SWOT Analysis
SWOT analysis is a planning method and the best way for effective exploring four major aspects for a business or a venture - strengths, weaknesses, opportunities and threats. Visually SWOT analysis results are depicted as a SWOT matrix, diagram or Mind Map, which is then included to the set of documents, report or in presentation devoted to demonstration the results of realized SWOT analysis for directors, shareholders, and other interested employees. ConceptDraw Solution Park includes the SWOT and TOWS Matrix Diagrams solution, which offers wide possibilities for realization SWOT analysis and creation SWOT Matrices and SWOT Mind Maps in ConceptDraw PRO and ConceptDraw MINDMAP software. This solution includes fully ready-to-use SWOT vector design elements, SWOT matrix samples and also useful templates that allow users create own SWOT diagrams and Mind Maps for business SWOT analysis in a few minutes. Use also the perfect ability of instantly exporting to various formats and of creation MS PowerPoint presentation right from the ConceptDraw applications.- Pyramid Diagram | UML Diagram Types List | Organizational culture ...
- Organizational culture - Triangle diagram | Pyramid Diagram ...
- Organizational culture - Triangle diagram | Pyramid Diagram | Matrix ...
- Diagram Of Organisational Development
- Organization Chart Templates | Create Organizational Chart ...
- Process Flowchart | Pyramid Diagram | Organizational culture ...
- Organizational culture - Triangle diagram | Custom Attribution
- Organizational culture - Triangle diagram | Matrix Organization ...
- Pyramid Diagram | Organizational culture - Triangle diagram ...
- Draw Company Structure with Organization Charting Software ...
- Www Diagram Of Organisational Development
- Schematic Diagram Of Organizational Culture
- Pyramid Diagram | Organizational culture - Triangle diagram | Cloud ...
- Pyramid Diagram | Pyramid Diagram | Organizational culture ...
- Organizational Structure | Organizational culture - Triangle diagram ...
- Block diagram - Types of individual behavior in organization | Basic ...
- Process Flowchart | Pyramid Diagram | Matrix Organization Structure ...
- Organisational Culture Flow Chart Diagram
- Flow Diagrams Of Organisation Culture
- Human Resource Development | Organizational culture - Triangle ...


