 Divided Bar Diagrams
The Divided Bar Diagrams Solution extends the capabilities of ConceptDraw PRO v10 with templates, samples, and a library of vector stencils for drawing high impact and professional Divided Bar Diagrams and Graphs, Bar Diagram Math, and Stacked Graph.
 Stakeholder Onion Diagrams
The Stakeholder Onion Diagram is often used as a way to view the relationships of stakeholders to a project goal. A basic Onion Diagram contains a rich information. It shows significance of stakeholders that will have has influence to the success achieve
This exploded pie chart sample shows the economic sector weightings. It was designed on the base of the Wikimedia Commons file: Badpie.png [commons.wikimedia.org/ wiki/ File:Badpie.png].
This image is available under the Creative Commons Attribution-ShareAlike 3.0 Unported License [creativecommons.org/ licenses/ by-sa/ 3.0/ ].
"The classical breakdown of all economic sectors follows:
Primary: Involves the retrieval and production of raw materials, such as corn, coal, wood and iron. (A coal miner and a fisherman would be workers in the primary sector.)
Secondary: Involves the transformation of raw or intermediate materials into goods e.g. manufacturing steel into cars, or textiles into clothing. (A builder and a dressmaker would be workers in the secondary sector.)
Tertiary: Involves the supplying of services to consumers and businesses, such as baby-sitting, cinema and banking. (A shopkeeper and an accountant would be workers in the tertiary sector.)
In the 20th century, it began to be argued that traditional tertiary services could be further distinguished from "quaternary" and quinary service sectors." [Economic sector. Wikipedia]
The exploded pie chart example "Economic sector weightings" was created using the ConceptDraw PRO diagramming and vector drawing software extended with the Pie Charts solution of the Graphs and Charts area in ConceptDraw Solution Park.
Exploded pie chart

Stakeholder Onion Diagrams

Basic Flowchart Symbols and Meaning


Cause and Effect Diagram

The vector stencils library "Telecom equipment" contains 11 hardware clipart icons of telecommunication devices for drawing computer network diagrams and equipment layouts.
"In telecommunication, a communications system is a collection of individual communications networks, transmission systems, relay stations, tributary stations, and data terminal equipment (DTE) usually capable of interconnection and interoperation to form an integrated whole. The components of a communications system serve a common purpose, are technically compatible, use common procedures, respond to controls, and operate in union. Telecommunications is a method of communication." [Communications system. Wikipedia]
"A basic telecommunication system consists of three primary units that are always present in some form: (1) A transmitter that takes information and converts it to a signal. (2) A transmission medium, also called the "physical channel" that carries the signal. ... (3) A receiver that takes the signal from the channel and converts it back into usable information." [Telecommunication. Wikipedia]
The clip art example "Telecom equipment - Vector stencils library" was created using the ConceptDraw PRO diagramming and vector drawing software extended with the Telecommunication Network Diagrams solution from the Computer and Networks area of ConceptDraw Solution Park.
Andrew multiband high / low power splitter

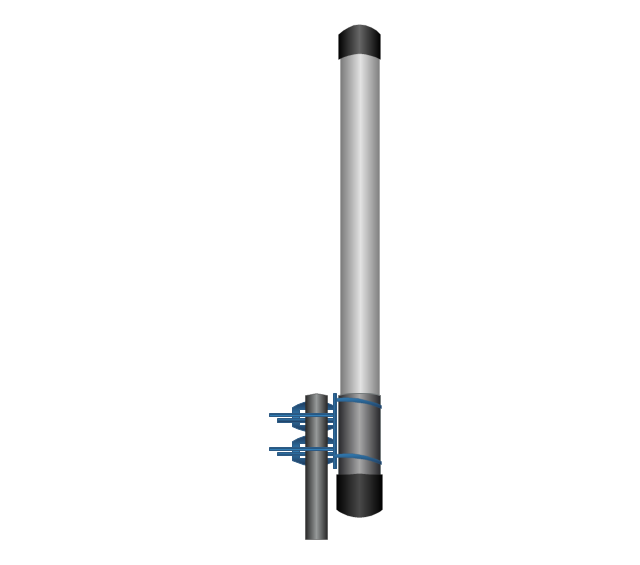
Andrew multi-band indoor omnidirectional antenna

Panel sector directional antenna

Omni directional antenna
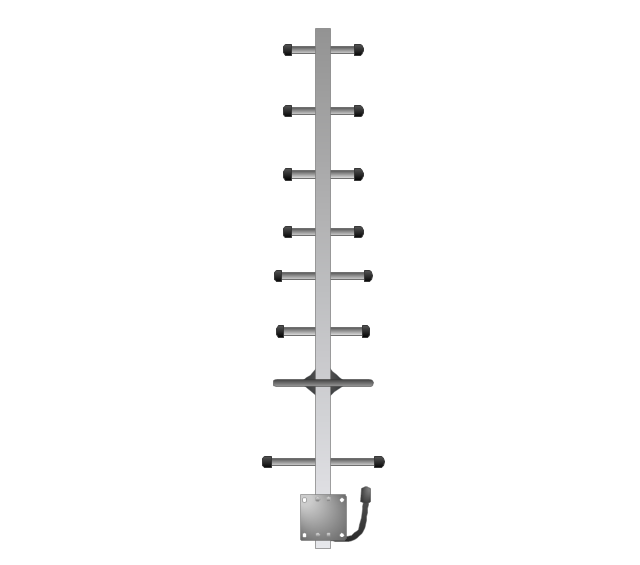
Yagi directional antenna
Yagi integrated downconverter

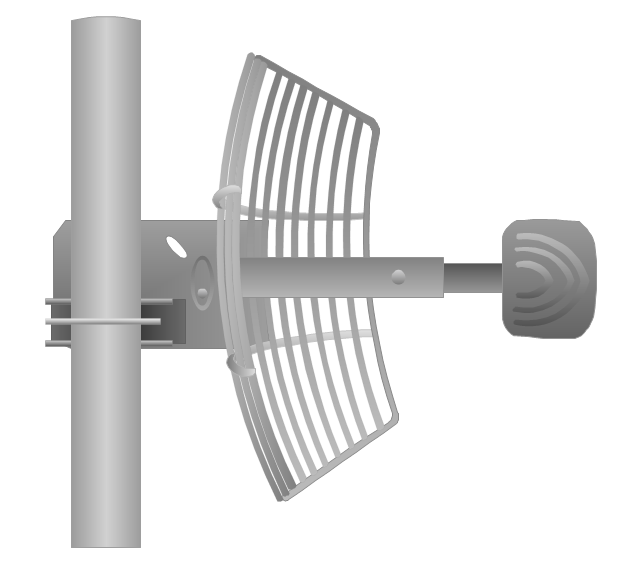
Grid antenna
Loop antenna

FireTide HotPort® 6000 wireless mesh nodes
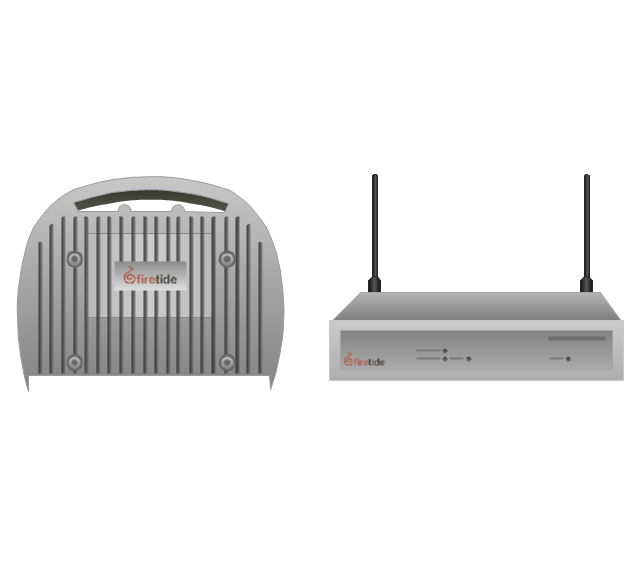
FireTide HotPoint® wireless access point
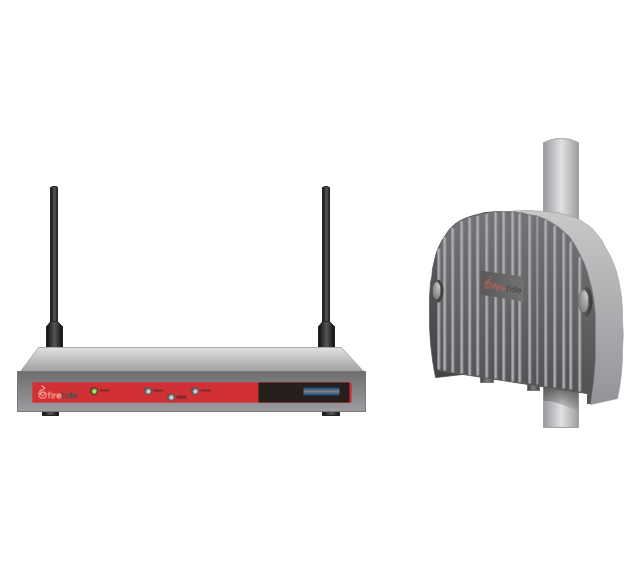
FireTide HotClient Customer Premises Equipment (CPE)
-telecom-equipment---vector-stencils-library.png--diagram-flowchart-example.png)
Social Media Flowchart Symbols

- A Flow Diagram Of Primary Sector
- Draw A Flow Chart To Show The Primary Sector Of Any Good The
- Stakeholder Onion Diagrams | Flow Chart Of The Primary Sector ...
- Diagram Of Primary Secondary And Tertiary Sectors
- Primary Secondary Tertiary Sectors Flow Diagrams Example
- Primary Secondary And Tertiary Sectors Of Clothing In Diagrams
- Design A Picture Which Shows Primary Sector
- Sector weightings - Exploded pie chart | Divided Bar Diagrams ...
- Primary Sector Secondary Sector And Tertiary Sector Flow Diagram
- Economic sector weightings | Divided Bar Diagrams | Stakeholder ...
- Show Diagram For Secondary Sector
- Divided Bar Diagrams | Primary Sector Drawing For Project
- Economic sector weightings | Divided Bar Diagrams | Stakeholder ...
- Primary Sector Image Drawing
- A Diagram Of Primary Sector
- Primary Industry Examples With Drawing
- Flow Chart Of Primary Sector Secondary Sector And Tertiary Sector
- Economic sector weightings | Primary Secondary And Tertiary ...
- Flow Chart Of Clothing Including Primary Sector Secondary Sector ...
- Divided Bar Diagrams | Pictures For Primary Sector For Drawing