 Sales Flowcharts
The Sales Flowcharts solution lets you create and display sales process maps, sales process workflows, sales steps, the sales process, and anything else involving sales process management.
 ConceptDraw Solution Park
ConceptDraw Solution Park collects graphic extensions, examples and learning materials
ConceptDraw MINDMAP: Brainstorming, Mind Mapping for macOS and Windows
ConceptDraw MINDMAP is a powerful business and personal productivity software application that provides visual organization and access to information for individuals and organizations.
 Business Process Workflow Diagrams
The Business Process Workflow Diagrams solution enhances the ConceptDraw PRO v10 functionality with predesigned examples, samples and a numerous collection of predesigned vector objects of workflow chart elements, icons, arrows, connectors, and varied wor
HelpDesk
How to Draw a Circular Arrows Diagram Using ConceptDraw PRO
The cyclic recurrence is a fundamental property of multiple systems. The cycle is a process which consists from elements (phases, stages, stages) following each other. Many processes in astronomy, biology, chemistry, physics, mathematics, etc. have a cycle properties. It is also widely used in information technologies and marketing analysis. Graphical representation of cyclic processes can have many forms. It can be a circle, parabola, hyperbola, ellipse and others. A Circular Arrows Diagram is used as one of the statistical charts in the business, mass media and marketing. ConceptDraw PRO provides its users tools for making easy drawing Circular Arrows Diagrams.
 Business Process Diagrams
Business Process Diagrams solution extends the ConceptDraw PRO BPM software with RapidDraw interface, templates, samples and numerous libraries based on the BPMN 1.2 and BPMN 2.0 standards, which give you the possibility to visualize equally easy simple and complex processes, to design business models, to quickly develop and document in details any business processes on the stages of project’s planning and implementation.
HelpDesk
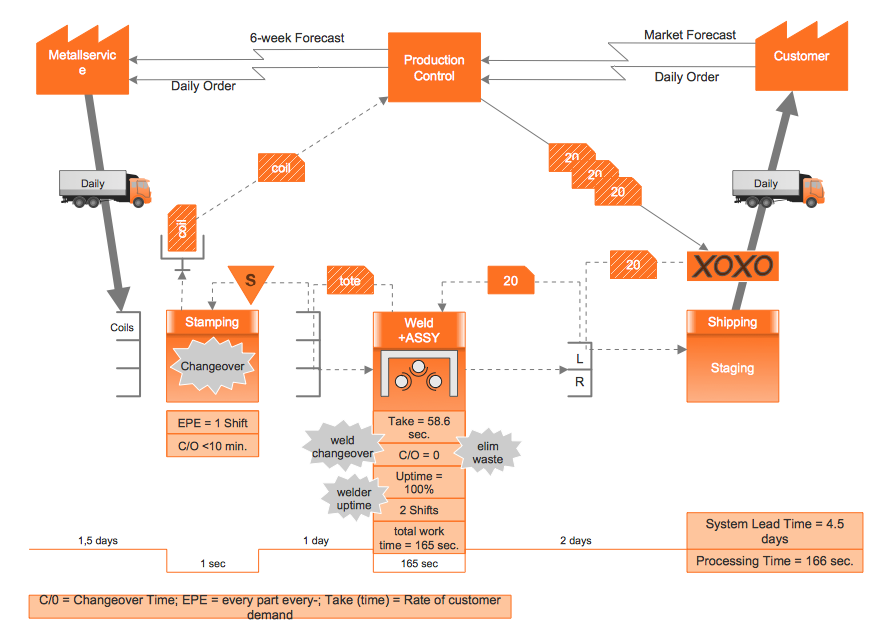
How to Create a VSM Diagram Using ConceptDraw Value Stream Mapping Solution
Value Stream Mapping is a Lean Manufacturing tool that uses a flow diagram to document in great detail every step of a manufacturing process. This graphical representation of a process is a powerful tool that helps in the diagnosis of process efficiency and allows companies to develop improved processes. Many lean practitioners use Value Stream Mapping as a fundamental tool to identify waste, cut process cycle times, and implement process improvement. Many organizations use value stream mapping as a key portion of their lean efforts. Value Stream Maps are used to analyze and design the flow of materials and information required to bring a product or service to a consumer. You can create a Value Stream Mapping flowchart using ConceptDraw PRO tools.- Sales Process Flowchart. Flowchart Examples | Sales Process ...
- Sales Process Flowchart. Flowchart Examples | Event-driven ...
- Sales Cycle System Diagram
- Sales Process Flowchart. Flowchart Examples | Sales Process Steps ...
- Sales Process Flowchart. Flowchart Examples | Sales Process ...
- Process Flowchart | Sales Process Flowchart. Flowchart Examples ...
- Sales Process Example Diagram
- Product life cycle process - Flowchart | Sales Process Flowchart ...
- Sales Process Flowchart. Flowchart Examples | Sales Process Steps ...
- Business Sales Process Diagram
- Car Sales Process Diagram
- Land sales process flowchart | How to Create a Timeline Diagram in ...
- Sales Process Flowchart. Flowchart Examples | Global liquidity ...
- Sales Process Flowchart. Flowchart Examples | Sales Flowcharts ...
- Relations diagram - Sales process
- Sales Process Flowchart. Flowchart Examples | Block diagram ...
- Copying Service Process Flowchart. Flowchart Examples | Process ...
- Sales Process Flowchart. Flowchart Examples | Marketing and Sales ...
- Sales Process Flowchart. Flowchart Examples | Sales Flowcharts ...
- Sales Process Flowchart. Flowchart Examples | Block Diagrams ...


