Design Pictorial Infographics. Design Infographics
In the course of recent decades data visualization went through significant development and has become an indispensable tool of journalism, business intelligence and science. The way visual information may be conveyed is not limited simply to static or dynamic representation, it can also be interactive. Infographics can be conditionally divided into several general levels. Primarily, this is level of visualization of information, its interpretation and association on any ground. Second level can be defined as a visualization of knowledge, depiction of thoughts and ideas in the form of images or diagrams. Finally, the level of data visualization, which processes data arrays in charts, enabling the information to be more clearly perceived. You can also identify the main approaches to the creation of infographics: exploratory and narrative. Exploratory method insists on minimalist design in favor of data precision without unnecessary details and is common for scientific researches and anaSysML Diagram
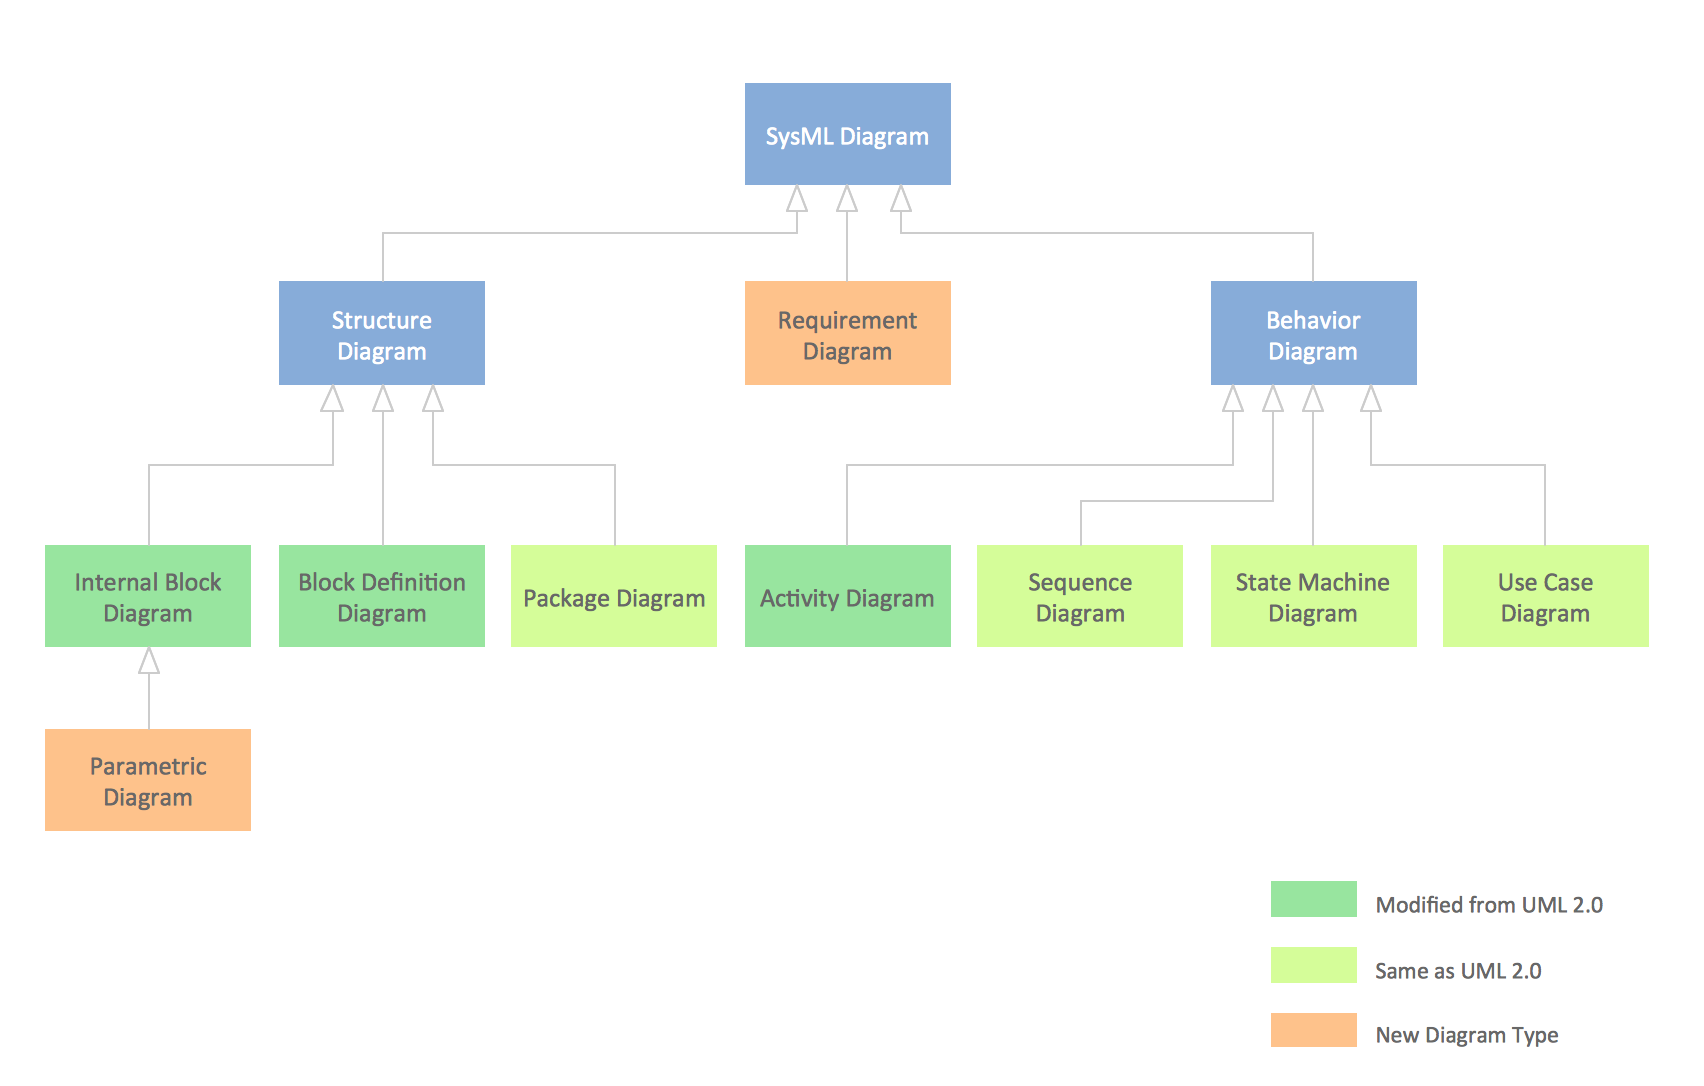
To draw SysML diagrams use the ConceptDraw PRO diagramming and vector drawing software extended with the Rapid UML solution from the Software Development area of ConceptDraw Solution Park.UML 2 4 Process Flow Diagram
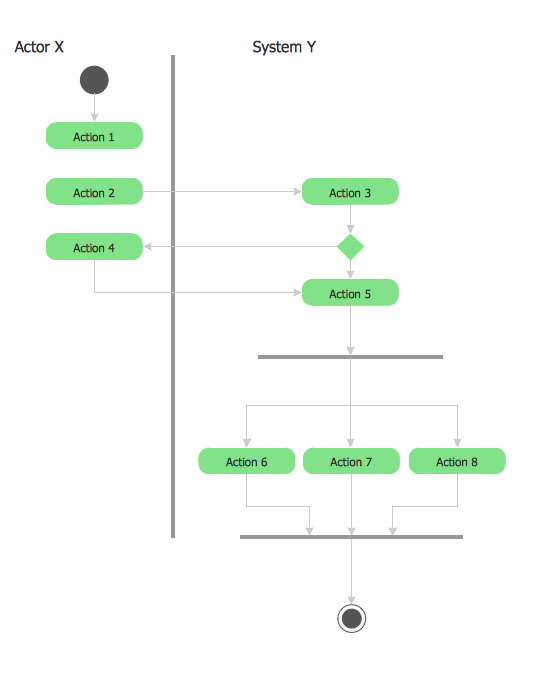
This sample was created in ConceptDraw PRO diagramming and vector drawing software using the UML Activity Diagram library of the Rapid UML Solution from the Software Development area of ConceptDraw Solution Park.Workflow Diagram Software
ConceptDraw PRO is workflow diagram software enhanced by numerous extentions from ConceptDraw Solution Park. It inludes many professional workflow diagrams, examples and ready to use workflow diagram and workflow symbols. Workflow symbol collections include symbols for Processes, Planning, Scheduling, Flow Control, In-Transit Process Visibility. The best workflow diagram software you may find is ConceptDraw PRO. ConceptDraw PRO is world-known diagramming software that works for both Windows and Mac OS X platforms. The software contains complete set of features allows to draw diagrams faster. ConceptDraw PRO extended with the Workflow Diagram solution provides additional libraries, templates and samples for drawing professional workflow diagrams.UML Class Diagram Generalization Example UML Diagrams
This sample was created in ConceptDraw PRO diagramming and vector drawing software using the UML Class Diagram library of the Rapid UML Solution from the Software Development area of ConceptDraw Solution Park. This sample describes the use of the classes, the generalization associations between them, the multiplicity of associations and constraints. Provided UML diagram is one of the examples set that are part of Rapid UML solution.UML Class Diagram Notation
When it comes to system construction, a class diagram is the most widely used diagram. UML Class Diagrams is a type of static structure diagram that is used for general conceptual modeling of the systematics of the application. Such a diagram would illustrate the object-oriented view of a system . The object orientation of a system is indicated by a class diagram. It describes the structure of a system by showing the general issues,classes of a system, attributes, operations, interfaces, inheritance, and the relationships between them.
 Aerospace and Transport
This solution extends ConceptDraw PRO software with templates, samples and library of vector clipart for drawing the Aerospace and Transport Illustrations. It contains clipart of aerospace objects and transportation vehicles, office buildings and anci
BPMN 2.0
ConceptDraw PRO diagramming and vector drawing software offers the Business Process Diagram Solution from the Business Processes Area of ConceptDraw Solution Park with powerful tools to help you easy represent the business processes and create the business process diagrams based on BPMN 2.0 standard.Sample Pictorial Chart. Sample Infographics
Sample Pictorial Chart - Pictorial Infographics solution provides easy-to-use design infographics drawing tools, large collection of different sample infographics and infograms, sample pictorial chart and templates to be filled in, and 10 libraries with great quantity of predesigned vector pictograms. Use Pictorial Infographics solution to draw your own design pictorial infographics documents quick and easy.Geo Map - Canada - Manitoba
Manitoba is a Canadian prairie province. The vector stencils library Manitoba contains contours for ConceptDraw PRO diagramming and vector drawing software. This library is contained in the Continent Maps solution from Maps area of ConceptDraw Solution Park.
 Business Process Workflow Diagrams
The Business Process Workflow Diagrams solution enhances the ConceptDraw PRO v10 functionality with predesigned examples, samples and a numerous collection of predesigned vector objects of workflow chart elements, icons, arrows, connectors, and varied wor
UML Diagram Types List
Two types of diagrams are used in UML: Structure Diagrams and Behavior Diagrams. Behavior Diagrams represent the processes proceeding in a modeled environment. Structure Diagrams represent the elements that compose the system.Geo Map - USA - Montana
Montana is a state in the Western United States. The vector stencils library Montana contains contours for ConceptDraw PRO diagramming and vector drawing software. This library is contained in the Continent Maps solution from Maps area of ConceptDraw Solution Park.Best Tool for Infographic Construction
ConceptDraw is a best data visualization tool that will allow everyone to create rich infographics and visualizations quickly and easily.- Tourism Project ER Diagram
- Dataflow Diagram Of Tourist Guide
- Diagram And Flowchat Of Tourist Guide
- Geo Map - USA - Montana
- Spatial infographics Design Elements: Location Map | 2D Directional ...
- Design Pictorial Infographics. Design Infographics | Aerospace and ...
- Uml Diagrams For Tourist With Pdf
- Travel and tourism pictograms - Vector stencils library | Design ...
- Directional Map Drawing Software
- 2D Directional map
- Directional Maps | Basic Flowchart Symbols and Meaning | Data ...
- Block Diagrams
- Show Erd Diagram For Tourism Management System
- House On Map Route
- Design Pictorial Infographics. Design Infographics | Continent Maps ...
- Directional Maps | How to Create a Directional Map Using ...
- Mathematics Symbols | How To use House Electrical Plan Software ...
- Jacobson Use Cases Diagram | UML Block Diagram | UML Diagram ...
- Data Flow Diagram Of Tourism Information System
- Tourism Erd Diagram


