Beauty in nature Illustrations and Clipart
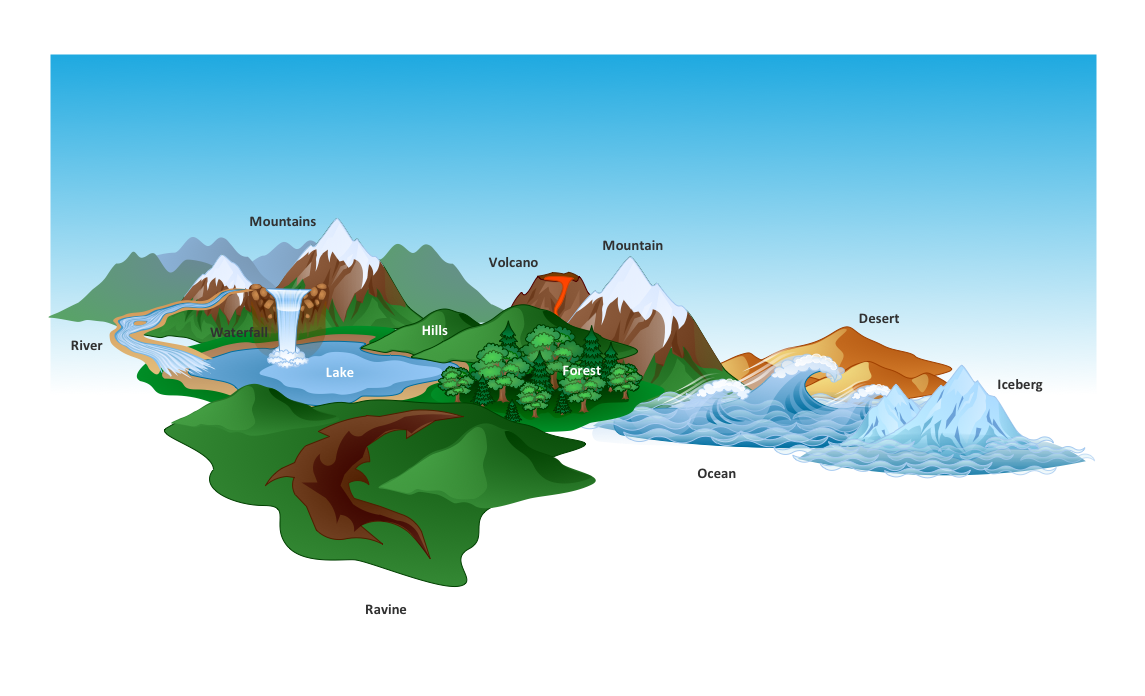
Nature solution expands our software possibilities to create beautiful illustrations and cliparts with the new library which contains 17 vector objects.Drawing a Nature Scene
ConceptDraw PRO is a drawings software for creating Nature scenes. Nature solution from ConceptDraw Solution Park expands this software with a new library that contains 17 vector objects and samples illustration files.Drawing Illustration
The Nature Solution addition to ConceptDraw Solution Park for ConceptDraw PRO includes new libraries that provide a wide range nature objects and it can be used in many areas.Beauty of Event-driven Process Chain (EPC) diagrams
Event-Driven Process Chain Diagrams for improvement throughout an organisation. ConceptDraw PRO - software that reduces the time needed to create a business process model.How to Draw a Natural Landscape
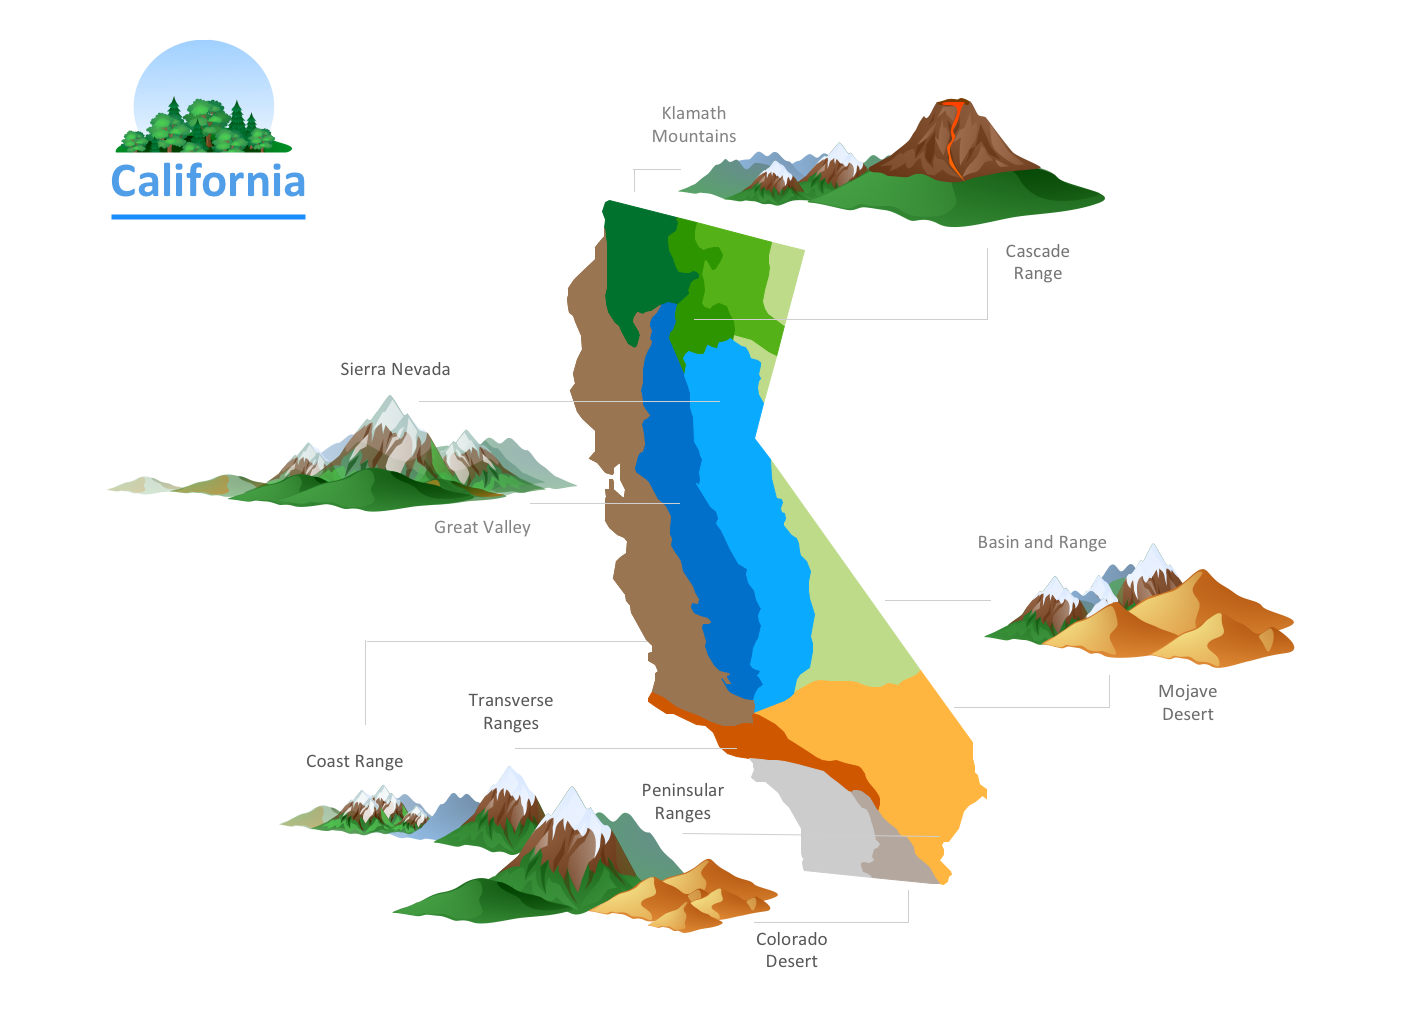
Nature solution expands ConceptDraw PRO software with samples, templates and libraries of vector clip art for drawing of Nature illustrations. Use Geography library of vector stencils to draw natural landscapes.Nature Drawings - How to Draw
Nature solution expands this software possibilities to create beautiful illustrations diagrams with the new library which contains 17 vector objects.How can you illustrate the weather condition
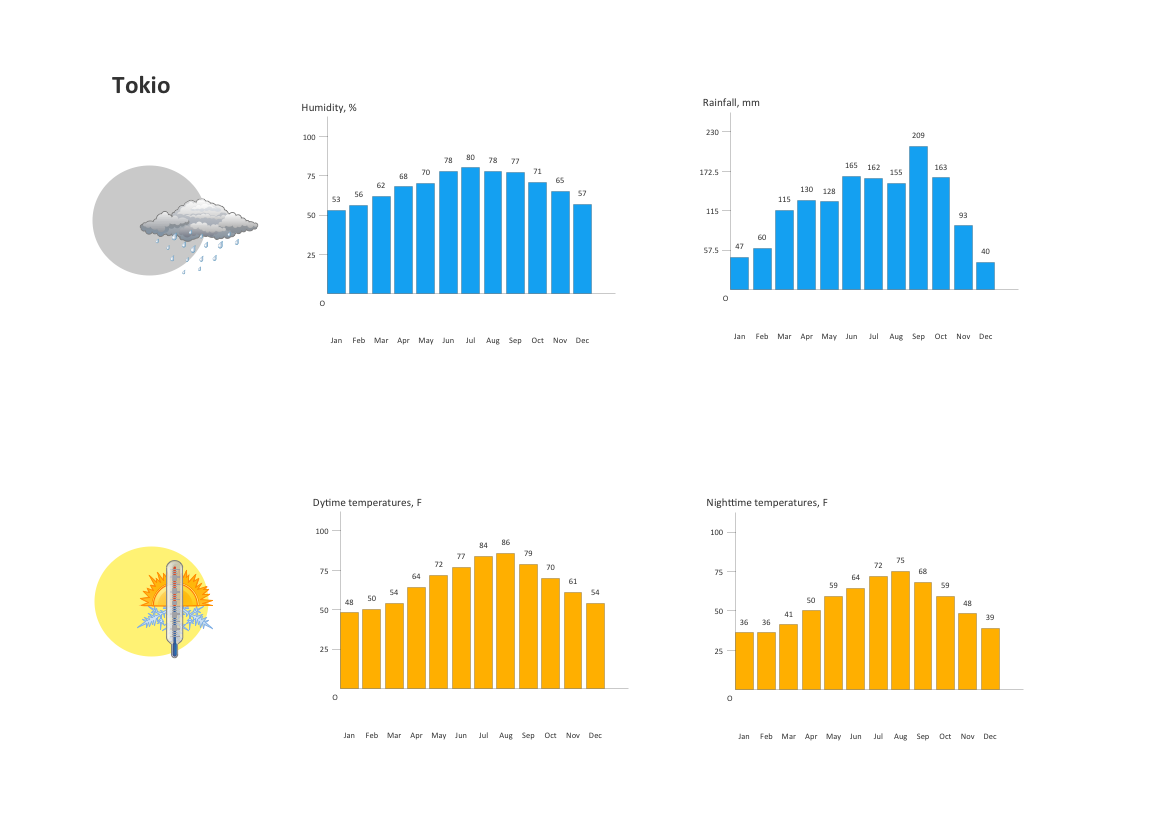
Use it to make professional looking documents, presentations, and websites illustrated with color scalable vector clipart for geography, weather, and animals.CORRECTIVE ACTIONS PLANNING. Involvement Matrix
The Involvement Matrix can identify the distribution of responsibilities and identify roles in a group or team. Use the Involvement Matrix to specify roles and responsibilities of actions in problem solving. ConceptDraw Office suite is a software for corrective actions planning.
Four Dimensions Bubble Plot
This sample was created in ConceptDraw PRO diagramming and vector drawing software using the Bubble Diagrams Solution from the "What is a Diagram" area of ConceptDraw Solution Park. This sample clearly shows the Four Dimensions Bubble Diagram of the distribution of chlorine contaminant in the water source. This Bubble Diagram is very useful in the chemistry, hydrology, and ecology.Business and Finance Illustrations
Choose the business illustration design you love best, and sign our design your own style with Business and Finance Illustrations library from ConceptDraw PRO. The Business and Finance solution contains 12 vector clipart libraries: Advertising, Business, Business people clipart, Business people figures, Currency, Mail and post, Management, Marketing, Money, Office, Project management, TimeNature Clipart and Illustrations
ConceptDraw PRO is a vector design software, it includes numerous vector stencils. Weather vector clipart library for ConceptDraw PRO allows the user to produce professional-looking illustrations in seconds.Basic Diagramming
Perfect charts and graphics diagramming software with rich examples and template. ConceptDraw is ideal to draw Charts and Graphics.
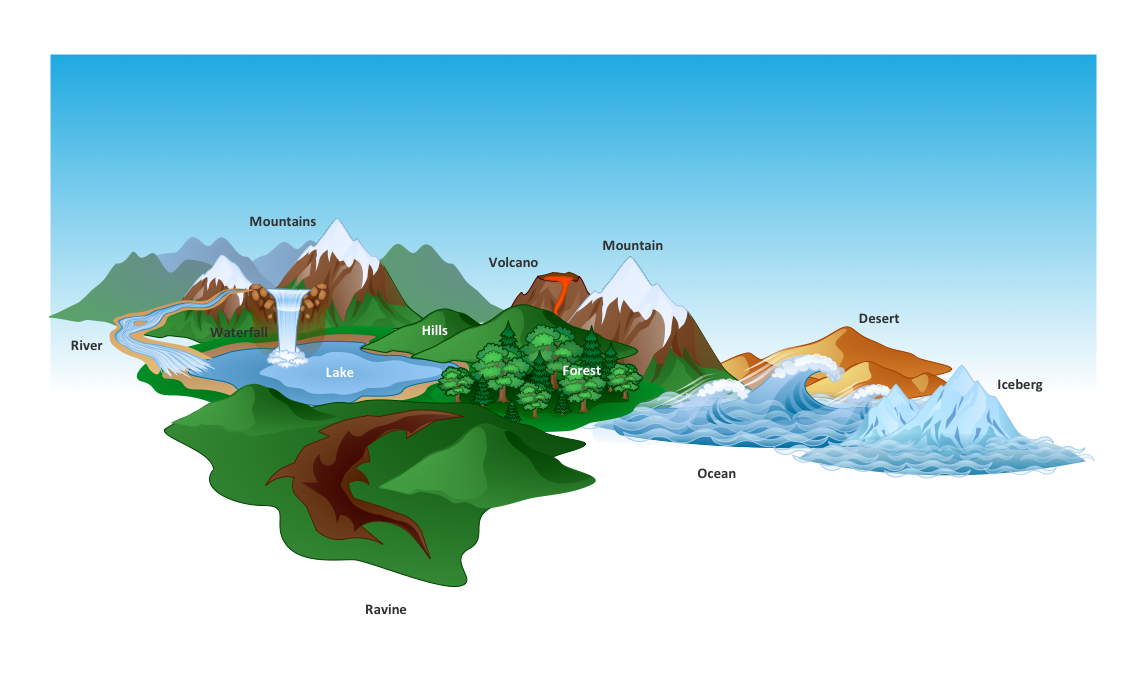
Beautiful Nature Scene: Drawing
The Nature Solution addition to ConceptDraw Solution Park for ConceptDraw PRO includes new libraries that provide a wide range nature objects and it can be used to augment documentation and graphics. Draw beautiful nature scenes using ConceptDraw PRO software with Nature solution.Computer Network Architecture. Computer and Network Examples
The network architecture and design specialization will help you gain the technical leadership skills you need to design and implement high-quality networks that support business needs.
Horizontal Flowchart
This sample was created in ConceptDraw PRO diagramming and vector drawing software using the Flowcharts solution from the What is a Diagram area of ConceptDraw Solution Park. A Flowchart is a graphically representation of the process, algorithm or the step-by-step solution of the problem. The Flowcharts have one or more starting and ending points. The geometric figures on the Flowcharts represent the steps of the process and are connected with arrows that show the sequence of the actions.- Water cycle diagram | Drawing Illustration | Drawing a Nature ...
- Diagrams Related To The Use Of Natural Resources
- Diagram Related To Natural Resources
- Resources and energy - Vector stencils library | Energy Pyramid ...
- Beauty in nature Illustrations and Clipart | E R Diagram Online ...
- Natural Resources Diagrams
- How to Draw Physics Diagrams in ConceptDraw PRO | Nature ...
- Food Court | ConceptDraw Solution Park | Beauty in nature ...
- Entity-Relationship Diagram (ERD) with ConceptDraw PRO ...
- Water cycle diagram | Drawing Illustration | Nature Clipart and ...
- Nature Related Drawing On Charts
- Biochemistry Related Diagrams
- Nature Drawings - How to Draw | How can you illustrate the weather ...
- Pictures of Vegetables | Food Court | Drawing a Nature Scene ...
- Beauty in nature Illustrations and Clipart | Basic Flowchart Symbols ...
- Pictures of Vegetables | Drawing a Nature Scene | Fruit Art | Easy ...
- Drawing Illustration | Drawing a Nature Scene | Draw Flowcharts ...
- Water cycle diagram | Drawing Illustration | Drawing a Nature ...
- Form Maker | How to Draw a Natural Landscape | Process Diagrams ...
- BPR Diagram . Business Process Reengineering Example | Beauty ...


