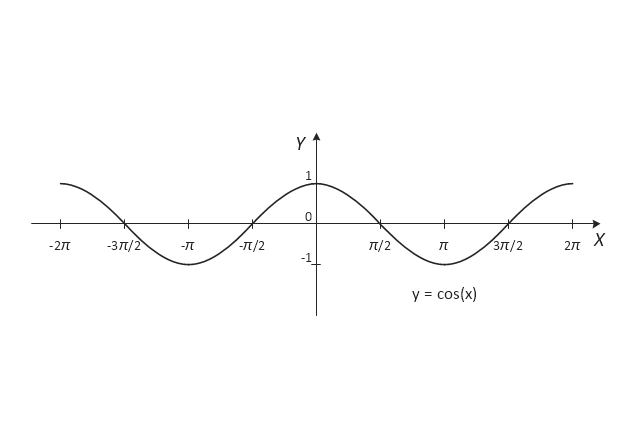
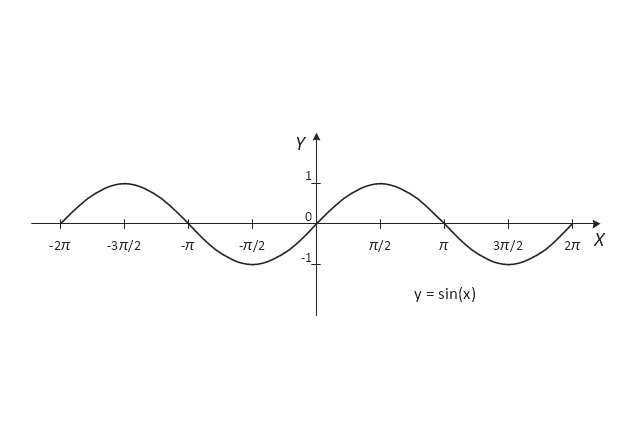
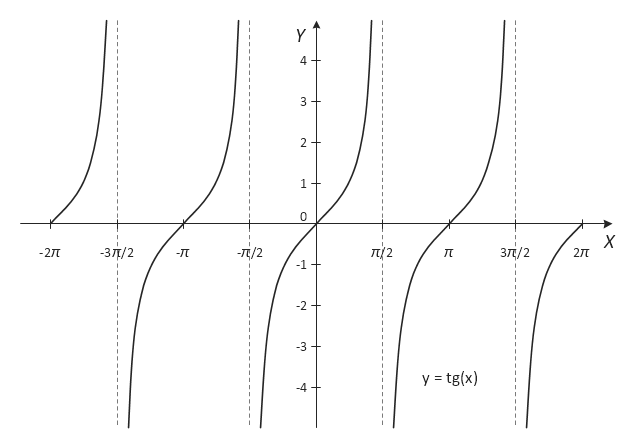
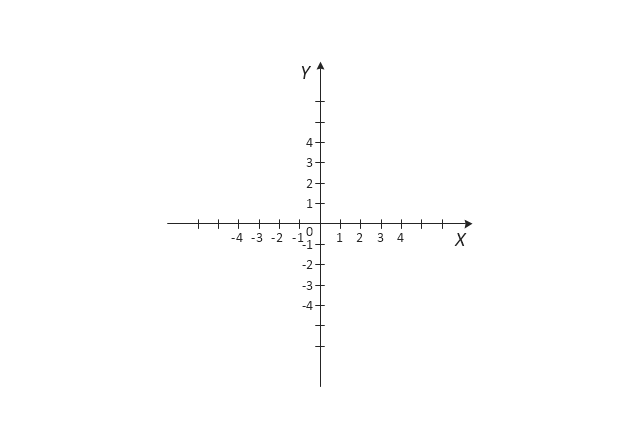
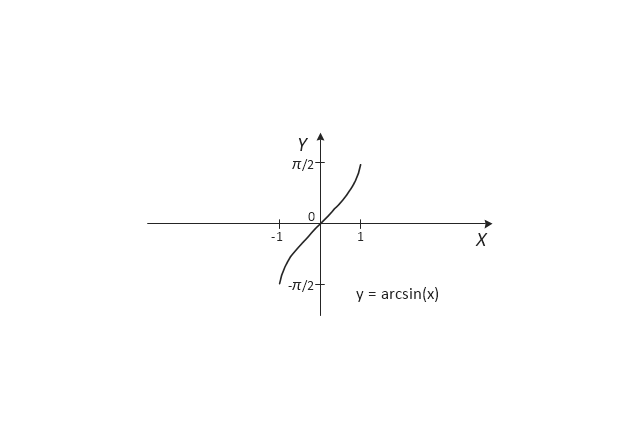
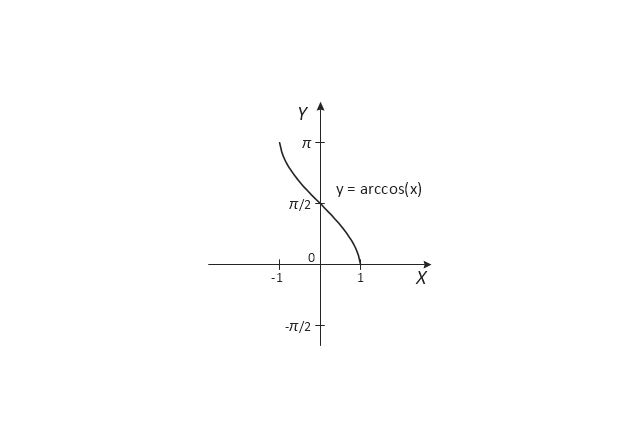
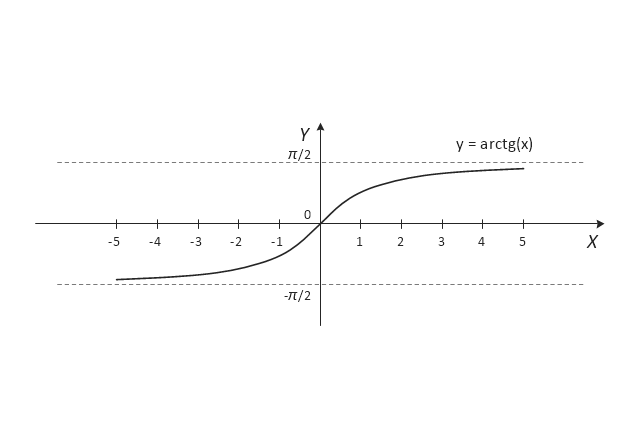
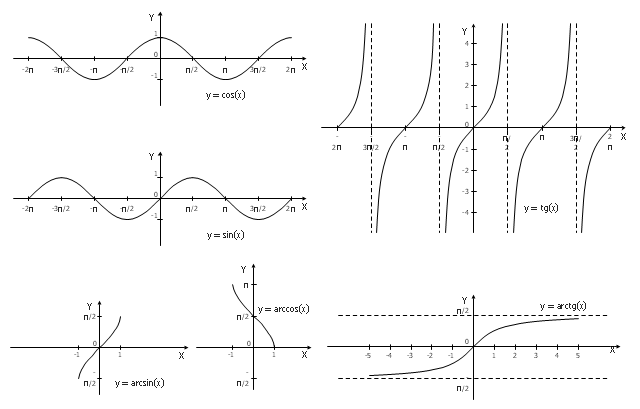
The vector stencils library "Trigonometric functions" contains 8 shapes of trigonometrical and inverse trigonometrical functions graphs: sine, cosine, tangent, arcsine, arccosine, arctangent, system axes.
Use these shapes to draw your geometrical diagrams and illustrations in the ConceptDraw PRO diagramming and vector drawing software extended with the Mathematics solution from the Science and Education area of ConceptDraw Solution Park.
Use these shapes to draw your geometrical diagrams and illustrations in the ConceptDraw PRO diagramming and vector drawing software extended with the Mathematics solution from the Science and Education area of ConceptDraw Solution Park.
Mathematical Diagrams
ConceptDraw PRO diagramming and vector drawing software extended with Mathematics solution from the Science and Education area is the best for creating: mathematical diagrams, graphics, tape diagrams various mathematical illustrations of any complexity quick and easy. Mathematics solution provides 3 libraries: Plane Geometry Library, Solid Geometry Library, Trigonometric Functions Library.Pie Chart Examples and Templates
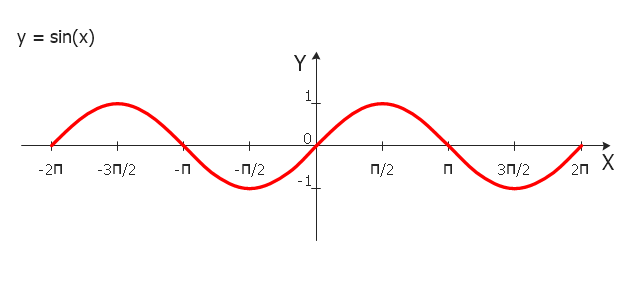
A pie chart or a circle graph is a circular chart divided into sectors, illustrating numerical proportion. In a pie chart, the arc length of each sector and consequently its central angle and area, is proportional to the quantity it represents. Pie chart examples and templates created using ConceptDraw PRO software helps you get closer with pie charts and find pie chart examples suite your needs."In mathematics, the sine function is a trigonometric function of an angle. The sine of an angle is defined in the context of a right triangle: for the specified angle, it is the ratio of the length of the side that is opposite that angle to (divided by) the length of the longest side of the triangle (i.e. the hypotenuse).
Trigonometric functions are commonly defined as ratios of two sides of a right triangle containing the angle, and can equivalently be defined as the lengths of various line segments from a unit circle. More modern definitions express them as infinite series or as solutions of certain differential equations, allowing their extension to arbitrary positive and negative values and even to complex numbers.
The sine function is commonly used to model periodic phenomena such as sound and light waves, the position and velocity of harmonic oscillators, sunlight intensity and day length, and average temperature variations throughout the year." [Sine. Wikipedia]
The trigonometric function graph example "Sine function" was created using the ConceptDraw PRO diagramming and vector drawing software extended with the Mathematics solution from the Science and Education area of ConceptDraw Solution Park.
The vector stencils library "Trigonometric functions" contains 8 shapes of trigonometrical and inverse trigonometrical functions graphs.
"In mathematics, the trigonometric functions (also called the circular functions) are functions of an angle. They relate the angles of a triangle to the lengths of its sides. Trigonometric functions are important in the study of triangles and modeling periodic phenomena, among many other applications.
The most familiar trigonometric functions are the sine, cosine, and tangent. In the context of the standard unit circle with radius 1 unit, where a triangle is formed by a ray originating at the origin and making some angle with the x-axis, the sine of the angle gives the length of the y-component (the opposite to the angle or the rise) of the triangle, the cosine gives the length of the x-component (the adjacent of the angle or the run), and the tangent function gives the slope (y-component divided by the x-component). More precise definitions are detailed below. Trigonometric functions are commonly defined as ratios of two sides of a right triangle containing the angle, and can equivalently be defined as the lengths of various line segments from a unit circle. More modern definitions express them as infinite series or as solutions of certain differential equations, allowing their extension to arbitrary positive and negative values and even to complex numbers." [Trigonometric functions. Wikipedia]
The shapes example "Design elements - Trigonometric functions" was created using the ConceptDraw PRO diagramming and vector drawing software extended with the Mathematics solution from the Science and Education area of ConceptDraw Solution Park.
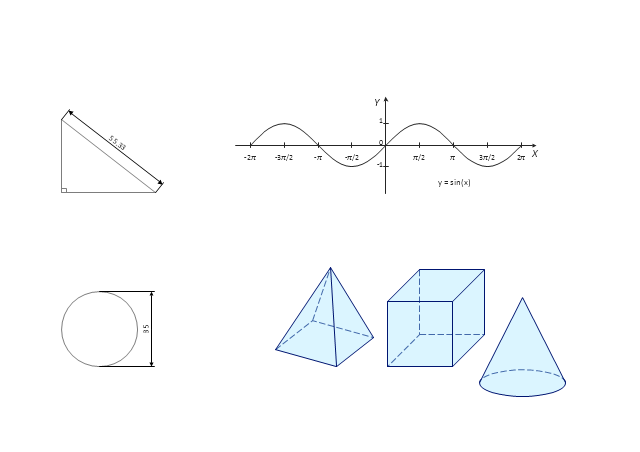
Use this mathematical drawings and graphs template to create your own math illustrations using the shapes of plane and solid geometric figures as well as trigonometric functions.
"Mathematical visualization or mathematical visualization is an aspect of geometry which allows one to understand and explore mathematical phenomena via visualization. Classically this consisted of two-dimensional drawings or building three-dimensional models (particularly plaster models in the 19th and early 20th century), while today it most frequently consists of using computers to make static two or three dimensional drawings, animations, or interactive programs. Writing programs to visualize mathematics is an aspect of computational geometry." [Mathematical visualization. Wikipedia]
The math illustrations template for the ConceptDraw PRO diagramming and vector drawing software is included in the Mathematics solution from the Science and Education area of ConceptDraw Solution Park.
 Mathematics
Mathematics solution extends ConceptDraw PRO software with templates, samples and libraries of vector stencils for drawing the mathematical illustrations, diagrams and charts.
- Tangent Diagram
- Sine function | Design elements - Trigonometric functions | Workflow ...
- X Axis And Y Axis On Line Graph
- 2^ x Function graph | Design elements - Education charts | Bubble ...
- Which Is The X And Y Axis
- Trigonometric functions - Vector stencils library | Gane Sarson ...
- Dealing with Difficult People | Trigonometric functions - Vector ...
- Trigonometric functions - Vector stencils library | Trigonometric ...
- Design elements - Trigonometric functions | Trigonometric functions ...
- Design elements - Trigonometric functions | Mathematical Diagrams ...
- Trigonometric functions - Vector stencils library | Scatter Plot | Bar ...
- How to Draw a Scatter Diagram Using ConceptDraw PRO | Design ...
- Design elements - Trigonometric functions | Sine function ...
- Math illustrations - Template | 3 Circle Venn Diagram . Venn Diagram ...
- X Axis Y Axis Line Graph
- Mathematics | Design elements - Trigonometric functions | Sine ...
- Plane geometry - Vector stencils library | How to Create a Line Chart ...
- Trigonometric functions - Vector stencils library | Trigonometric ...
- Mathematical Diagrams | Mathematics Symbols | How to Draw ...
- Mathematics Symbols | Mathematical Diagrams | Math illustrations ...
