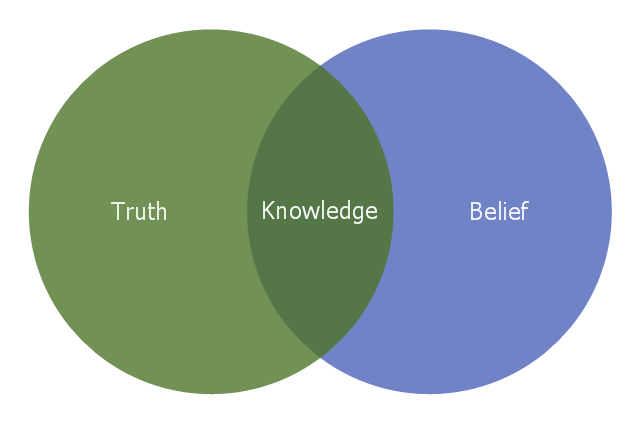
This Venn diagram sample illustrates the Plato's definition of knowledge. It was designed on the base of the Wikimedia Commons file: Belief Venn diagram.svg. [commons.wikimedia.org/ wiki/ File:Belief_ Venn_ diagram.svg]
"Justified true belief is a definition of knowledge that is most frequently credited to Plato and his dialogues. The concept of justified true belief states that in order to know that a given proposition is true, one must not only believe the relevant true proposition, but one must also have justification for doing so. In more formal terms, a subject S knows that a proposition P is true if and only if:
(1) P is true,
(2) S believes that P is true, and
(3) S is justified in believing that P is true" [Justified true belief. Wikipedia]
The Venn diagram example "Knowledge" was created using the ConceptDraw PRO diagramming and vector drawing software extended with the Venn Diagrams solution from the area "What is a Diagram" of ConceptDraw Solution Park.
Venn diagram
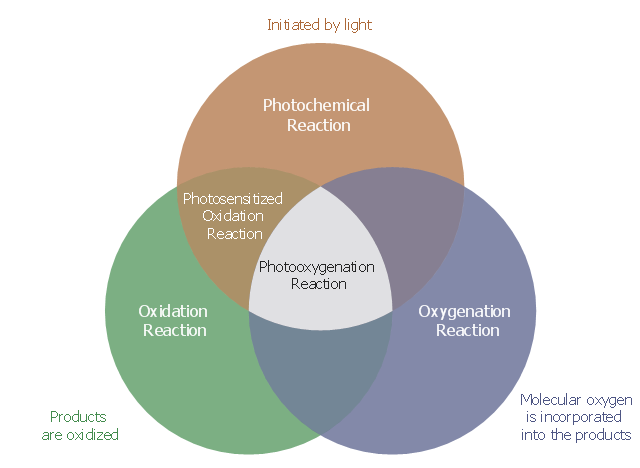
This Venn diagram sample shows the differentiating between photochemical/ oxidation terminology. It was designed on the base of the Wikimedia Commons file: Photooxygenation venn diagram.svg. [commons.wikimedia.org/ wiki/ File:Photooxygenation_ venn_ diagram.svg]
This file is licensed under the Creative Commons Attribution 3.0 Unported license.
[creativecommons.org/ licenses/ by/ 3.0/ deed.en]
"A photooxygenation is a light-induced oxidation reaction in which molecular oxygen is incorporated into the product(s). ... Early studies of photooxygenation focused on oxidative damage to DNA and amino acids, but recent research has led to the application of photooxygenation in organic synthesis and photodynamic therapy.
Photooxygenation reactions are initiated by a photosensitizer, which is a molecule that enters an excited state when exposed to light of a specific wavelength (e.g. dyes and pigments). The excited sensitizer then reacts with either a substrate or ground state molecular oxygen, starting a cascade of energy transfers that ultimately result in an oxygenated molecule. Consequently, photooxygenation reactions are categorized by the type and order of these intermediates (as type I, type II, or type III reactions). ...
Photooxygenation reactions are easily confused with a number of processes baring similar names (i.e. photosensitized oxidation). Clear distinctions can be made based on three attributes: oxidation, the involvement of light, and the incorporation of molecular oxygen into the products" [Photooxygenation. Wikipedia]
The Venn diagram example "Photooxygenation" was created using the ConceptDraw PRO diagramming and vector drawing software extended with the Venn Diagrams solution from the area "What is a Diagram" of ConceptDraw Solution Park.
Venn diagram
Venn Diagram Examples for Problem Solving. Venn Diagram as a Truth Table

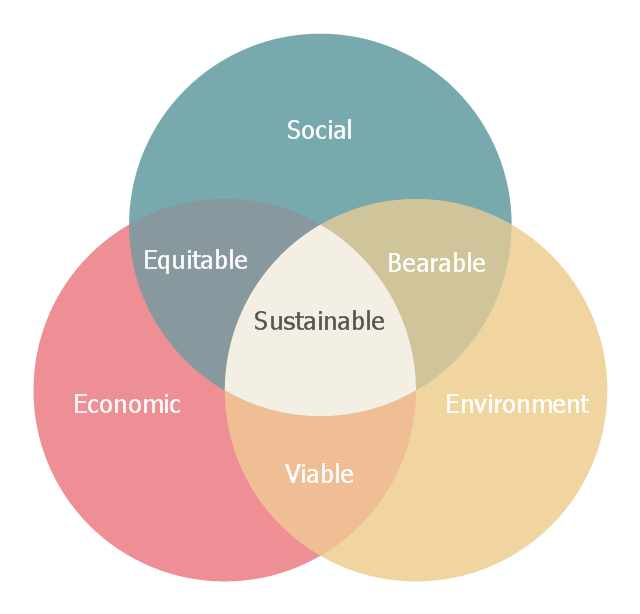
This Venn diagram sample shows the sustainable development at the confluence of three constituent parts: social, economic and environment. It was designed on the base of the Wikimedia Commons file: Sustainable development.svg.
[commons.wikimedia.org/ wiki/ File:Sustainable_ development.svg]
This file is licensed under the Creative Commons Attribution-Share Alike 3.0 Unported license. [creativecommons.org/ licenses/ by-sa/ 3.0/ deed.en]
"Sustainable development is an organizing principle for human life on a finite planet. It posits a desirable future state for human societies in which living conditions and resource-use meet human needs without undermining the sustainability of natural systems and the environment, so that future generations may also have their needs met.
Sustainable development ties together concern for the carrying capacity of natural systems with the social and economic challenges faced by humanity. " [Sustainable development. Wikipedia]
The Venn diagram example "Sustainable development" was created using the ConceptDraw PRO diagramming and vector drawing software extended with the Venn Diagrams solution from the area "What is a Diagram" of ConceptDraw Solution Park.
Venn diagram
Venn Diagram Examples for Problem Solving

Pyramid Diagram

Pyramid Diagram

The Best Flowchart Software Available


Pyramid Diagram

Program Structure Diagram

Best Diagramming Software for macOS


Best Vector Drawing Application for Mac OS X

Software Diagrams

Best Flowcharts

- Venn Diagrams | Venn Diagram Examples for Problem Solving ...
- 3 Circle Venn Diagram . Venn Diagram Example | Multi Layer Venn ...
- Venn Diagrams | 3 Circle Venn Diagram . Venn Diagram Example ...
- Knowledge - Venn diagram | Venn Diagram Examples for Problem ...
- Venn Diagram Template for Word | Venn Diagrams | Venn Diagram ...
- Knowledge - Venn diagram | Justified True Belief Ben Diagram
- Venn Diagram Examples for Problem Solving. Venn Diagram as a ...
- Interactive Venn Diagram | Venn Diagrams | How to Create a Venn ...
- Venn Diagram Examples for Problem Solving. Environmental Social ...
- Venn Diagram | Cylinder Venn Diagram | Venn Diagram Template ...
- Venn Diagram Examples | Photooxygenation | Venn Diagram Maker ...
- Sustainable development | Sustainable Development Svg
- DroidDia prime | Lead to opportunity sales flow | Pyramid Diagram ...
- Interactive Venn Diagram | Venn Diagrams | Interactive Voice ...
- How to Create a Venn Diagram in ConceptDraw PRO | Venn ...
- Ishikawa fishbone diagram | How to Construct a Fishbone Diagram ...
- Venn diagram - Path to sustainable development | Sustainable ...
- Venn Diagram Examples for Problem Solving. Environmental Social ...
- Venn Diagram Examples for Problem Solving. Environmental Social ...
- Sustainable development | Venn Diagram | Basic Circles Venn ...