Cross-Functional Flowchart
Use of Cross-Functional Flowchart is a clear way of showing each team member’s responsibilities and how processes get shared or transferred between different responsible people, teams and departments. Use the best flowchart maker ConceptDraw DIAGRAM with a range of standardized cross-functional flowchart symbols to create the Cross-Functional Flowcharts simply and to visualize the relationship between a business process and the functional units responsible for that process. To draw the most quickly Cross-Functional Flowcharts, Cross Functional Process Maps, or Cross Functional Process Flow Diagrams, start with a Cross-functional flowchart samples and templates from ConceptDraw Solution Park. The ConceptDraw Arrows10 and RapidDraw technologies will be also useful for you in drawing. ConceptDraw DIAGRAM supports designing both types - horizontal and vertical Cross-functional flowcharts. A vertical layout makes the accents mainly on the functional units while a horizontal layout - on the process. If you need a Visio alternative in Mac OS X, try ConceptDraw DIAGRAM. Its interface is very intuitive and it’s actually much easier to use than Visio, yet somehow it’s just as powerful if not more so. ConceptDraw DIAGRAM performs professional quality work and seamless Visio interaction.
HelpDesk
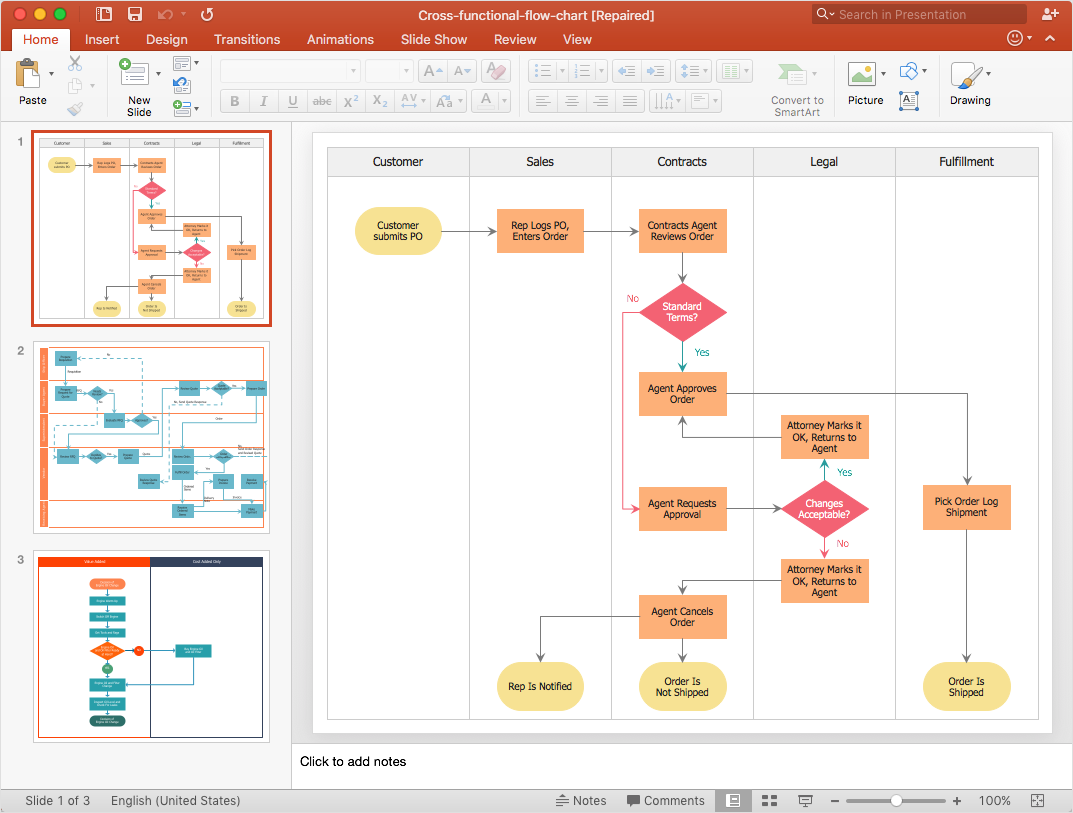
How to Add a Cross-Functional Flowchart to a PowerPoint Presentation
Using a Cross-Functional flowchart is a clear way of showing how business processes get shared or transferred between different teams and departments. ConceptDraw DIAGRAM allows you to make an MS PowerPoint Presentation from your flowcharts in a few simple steps.ConceptDraw Arrows10 Technology
Auto-connection mode - This is more than enough versatility to draw any type of diagram with any degree of complexity. How should diagramming software work? Is it possible to develop a diagram as quickly as the ideas come to you? The innovative Auto-connection mode is what you need to start draw.Management Tools — Total Quality Management
The Total Quality Management Diagram solution helps your organization visualize business and industrial processes. Create Total Quality Management diagrams for business process with ConceptDraw software.Diagrama de Topologia
PRO is a powerful drawing tool that changes the way diagrams are produced. ConceptDraw Arrows10 Technology - This is more than enough versatility to draw any type of diagram with any degree of complexity. Diagrama de Topologia or Topology Diagram helps you see the big picture as you develop a service.Creando Diagramas
ConceptDraw DIAGRAM es una conocida y popular aplicación de gráficos de negocios y diagramas para Windows y Macintosh. Contiene potentes herramientas de dibujo vectorial, bibliotecas de gráficos con cientos de formas pre-dibujados, soporte para importación y exportación de numerosos formatos de archivos y muchas otras características profesionales.Crea Diagramas De Flujo
No need for any special drawing skills to create professional looking diagrams outside of your knowledge base. ConceptDraw DIAGRAM takes care of the technical details, allowing you to focus on your job, not the drawing.Making Diagrams Has Never Been Easier
The innovative ConceptDraw DIAGRAM is a powerful drawing tool that changes the way diagrams are produced. While making diagrams has never been easier. This is more than enough versatility to draw any type of diagram with any degree of complexity.ConceptDraw Arrows10 Technology
Imagine the diagram which is looking smart. That is how ConceptDraw Arrows10 Technology or Smart connectors work. Thanks to auto-routing feature connectors flow around objects. But if you want some background objects that the connectors flow through - that is also possible to do.Draw Fishbone Diagram on MAC Software
The problem solving and decision-making processes are closely linked and crucial for the business and life. There are many tools and techniques for facilitating and improvement these processes, and also enhancement the quality of accepted decisions. One of them is Fisbone Diagram or Cause and Effect diagram. For its construction, you need first define the problem which you need to solve (existing or potential), write it into rectangular and draw to it a horizontal line - a “fish spine”. Then define general types of possible causes like Persons, Materials, Methods, Machinery, Measurements or Environment, and attach them to “spine”. Start brainstorming the possible reasons of failure and connect them to the branches. Professional diagramming ConceptDraw DIAGRAM MAC OSX software offers the Fishbone Diagrams solution which contains templates, samples, and ready Fishbone design objects. Use of them lets effectively identify the possible causes for an effect, realize successfully cause and effect analysis, and instantly draw Fishbone diagram on Mac software.- Cross-Functional Flowcharts | How to Create an Enterprise ...
- Cross-Functional Flowcharts | How to Add a Cross-Functional ...
- Cross Functional Flowchart Examples | Diagrama de Topologia ...
- Cross-Functional Flowcharts | How to Create an Enterprise ...
- Swim Lane Diagram Visio
- ConceptDraw Solution Park | Cross-Functional Flowcharts | Project ...
- How to Create a Timeline Diagram in ConceptDraw PRO | How To ...
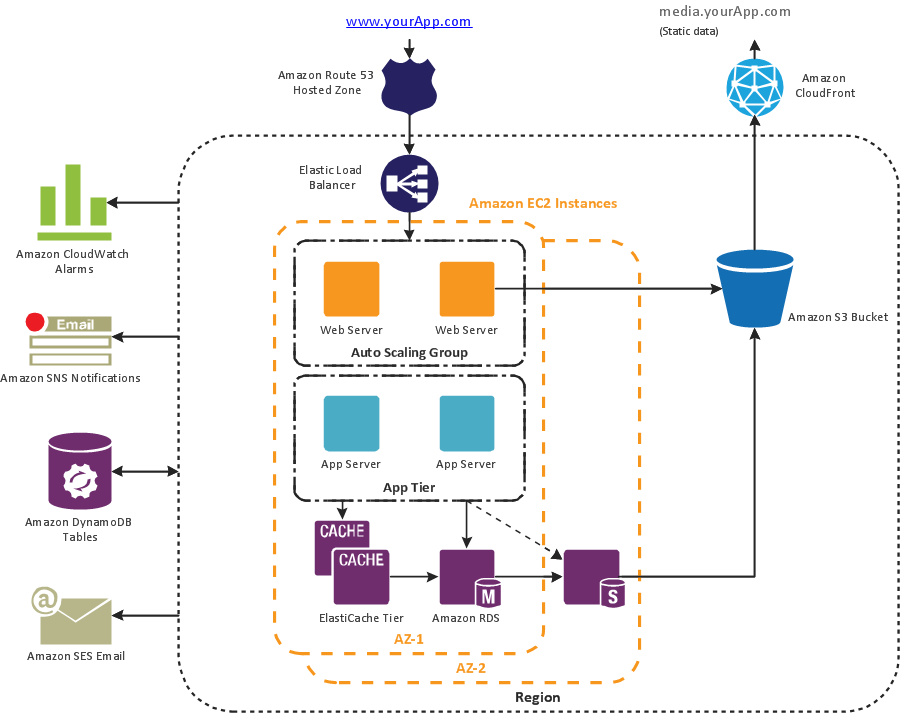
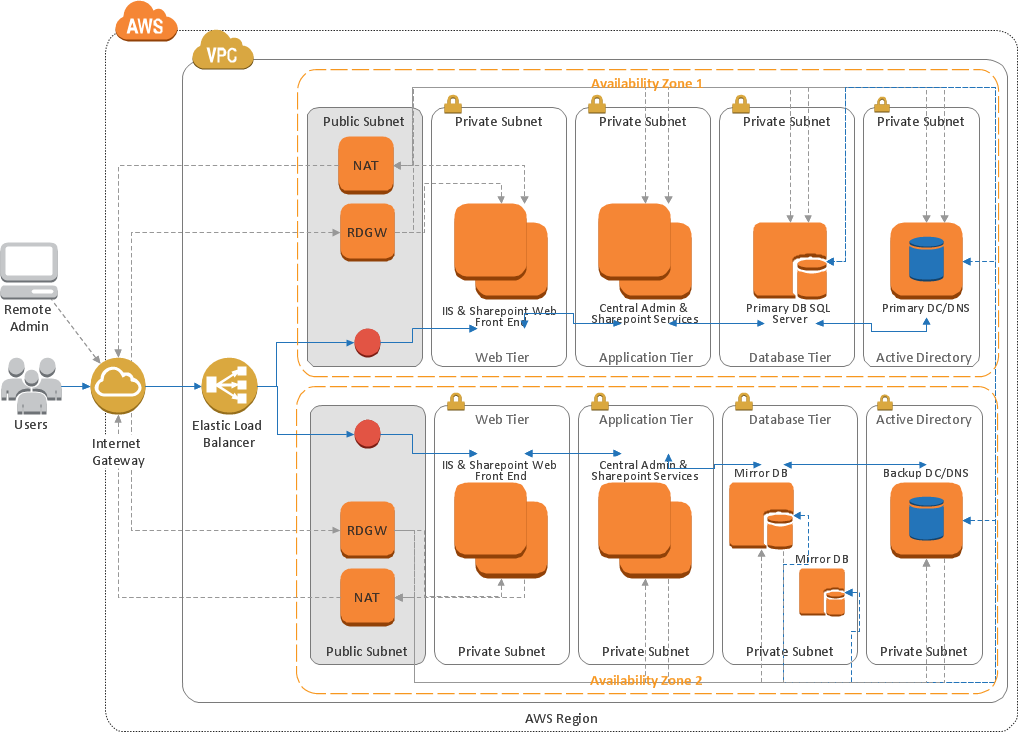
- AWS Architecture Diagrams | Diagrama de Topologia | Making ...
- Create Professional Looking Diagrams | Fishbone Diagram | Cross ...

