Diagrama de Topologia
PRO is a powerful drawing tool that changes the way diagrams are produced. ConceptDraw Arrows10 Technology - This is more than enough versatility to draw any type of diagram with any degree of complexity. Diagrama de Topologia or Topology Diagram helps you see the big picture as you develop a service.Crea Diagramas De Flujo
No need for any special drawing skills to create professional looking diagrams outside of your knowledge base. ConceptDraw DIAGRAM takes care of the technical details, allowing you to focus on your job, not the drawing.Software for Drawing EPC Diagrams
Event-Driven Process chain Diagrams for improvement throughout an organisation. ConceptDraw DIAGRAM - software that reduces the time needed to create a business process model.Cross Functional Flowchart Shapes Stencil
ConceptDraw DIAGRAM diagramming software provides vector shapes and connector tools for quick and easy drawing diagrams for business, technology, science and education. ConceptDraw Solution Park include professional set of libraries for Cross Functional Flowchart Shapes StencilConceptDraw Arrows10 Technology
How should diagramming software work? Is it possible to develop a diagram as quickly as the ideas come to you? The innovative ConceptDraw Smart Connectors Technology - This is more than enough versatility to draw any type of diagram with any degree of complexity. Connection points are necessary for diagramming network, flowchart and organizational charts. In ConceptDraw you connect shapes by attaching, or snapping and gluing, connectors to shape connection points.Onion Diagram Process Design
Onion diagram is a type of circular diagram that consists of the core circle representing the product/solution and concentric circles around it, which dependent on the core and look like the cross sections of onion. ConceptDraw DIAGRAM diagramming and vector drawing software supplied with Stakeholder Onion Diagrams Solution from the Management Area of ConceptDraw Solution Park is an ideal software for effective Onion diagram process design.How to Make Audio and Video Connections
Use the ConceptDraw DIAGRAM software that has vector clipart of numerous cable connectors, examples, and templates for drawing different types of audio and video connection diagrams. Paste icon of the receiver or another device to page and layout sockets and plugs. Further connect plugs with each other, and now you have well-designed connection diagram.Amazon Cloud
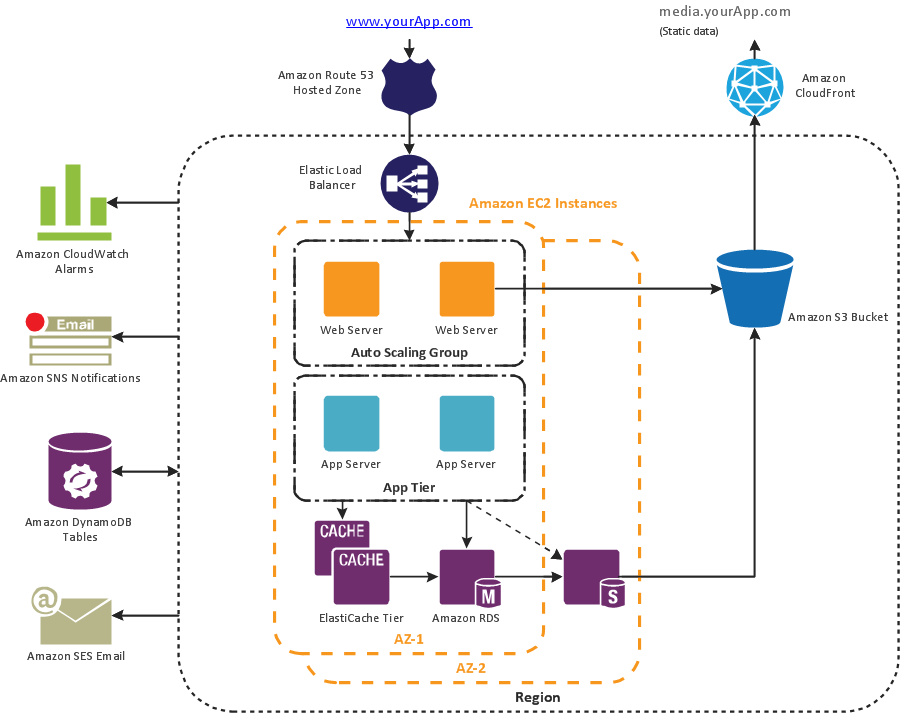
Data storage in clouds is very popular and widely used in the modern world. The Amazon is one of the companies which provide this service. Amazon Web Services offers the inexpensive and reliable cloud computing services, that's why many large companies prefer the Amazon Cloud for storage and operating their data. It is convenient to draw various AWS diagrams explaining the use of amazon cloud with help of tools of AWS Architecture Diagrams Solution from the Computer and Networks Area of ConceptDraw Solution Park.Basic of Flowchart: Meaning and Symbols
Flowcharts are the best for visually representation the business processes and the flow of a custom-order process through various departments within an organization. ConceptDraw DIAGRAM diagramming and vector drawing software extended with Flowcharts solution offers the full set of predesigned basic flowchart symbols which are gathered at two libraries: Flowchart and Flowcharts Rapid Draw. Among them are: process, terminator, decision, data, document, display, manual loop, and many other specific symbols. The meaning for each symbol offered by ConceptDraw gives the presentation about their proposed use in professional Flowcharts for business and technical processes, software algorithms, well-developed structures of web sites, Workflow diagrams, Process flow diagram and correlation in developing on-line instructional projects or business process system. Use of ready flow chart symbols in diagrams is incredibly useful — you need simply drag desired from the libraries to your document and arrange them in required order. There are a few serious alternatives to Visio for Mac, one of them is ConceptDraw DIAGRAM. It is one of the main contender with the most similar features and capabilities.What Is a Wireless Network? Professional Network Drawing
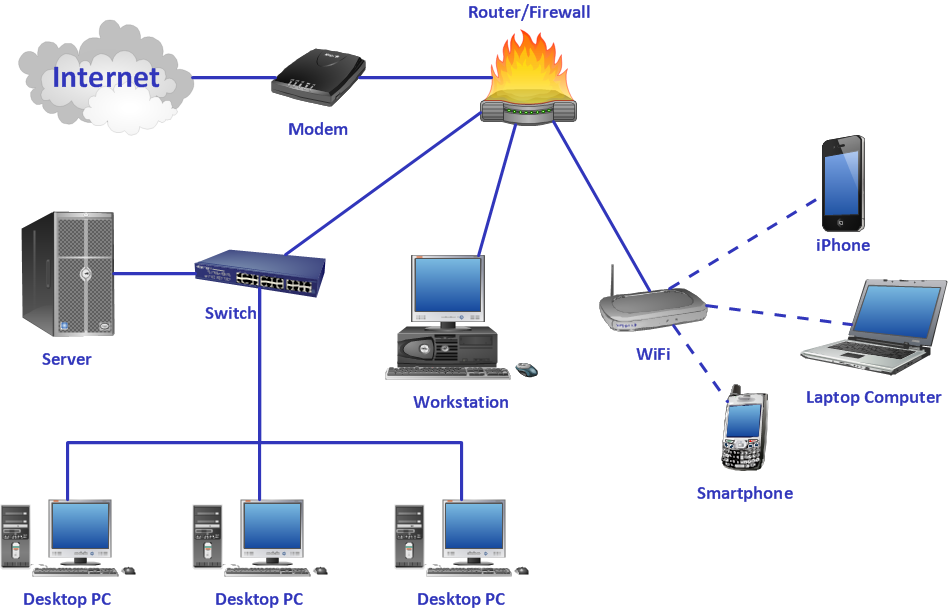
What Is a Wireless Network? Wireless network refers to any type of computer network that uses wireless (usually, but not always radio waves) for network connections. Wireless computer network diagrams help system administrators and network engineers to find out amount and type of equipment needed for each office WLAN.What Is a Wireless Network? Professional Network Drawing
What Is a Wireless Network? Wireless network refers to any type of computer network that uses wireless (usually, but not always radio waves) for network connections. Wireless computer network diagrams help system administrators and network engineers to find out amount and type of equipment needed for each office WLAN.Bubble diagrams in Landscape Design with ConceptDraw DIAGRAM
Bubble Diagrams are the charts with a bubble presentation of data with obligatory consideration of bubble's sizes. They are analogs of Mind Maps and find their application at many fields, and even in landscape design. At this case the bubbles are applied to illustrate the arrangement of different areas of future landscape design, such as lawns, flowerbeds, playgrounds, pools, recreation areas, etc. Bubble Diagram helps to see instantly the whole project, it is easy for design and quite informative, in most cases it reflects all needed information. Often Bubble Diagram is used as a draft for the future landscape project, on the first stage of its design, and in case of approval of chosen design concept is created advanced detailed landscape plan with specification of plants and used materials. Creation of Bubble Diagrams for landscape in ConceptDraw DIAGRAM software is an easy task thanks to the Bubble Diagrams solution from "Diagrams" area. You can use the ready scanned location plan as the base or create it easy using the special ConceptDraw libraries and templates.Fishbone Software Tools for Design Element
Cause and Effect diagram (Ishikawa diagram or Fishbone diagram) software helps you to show in one diagram the factors of Equipment, People, Process, Environment, Management and Materials, which all in general affect the overall problem and gives the base for the further analysis. ConceptDraw DIAGRAM is perfect software for designers and software developers who need to create Fishbone diagrams. You will get a simple problem-analysis tool - Fishbone software tools for design element to easy construct specific diagrams and identify many possible causes for an effect to attack complex problem solving.Diagramming Software for Design UML State Machine Diagrams
UML state machine's goal is to overcome the main limitations of traditional finite-state machines while retaining their main benefits.Examples of Flowchart Diagram
ConceptDraw - feature-rich flowchart software. This software includes flowchart diagram examples set. Libraries contain vector stencils that allow users to use RapidDraw technology. Users can start draw their own flowchart diagrams from existing examples by clicking on direction arrows.Is ConceptDraw DIAGRAM an Alternative to Microsoft Visio?
Visio for Mac and Windows - ConceptDraw as an alternative to MS Visio. ConceptDraw DIAGRAM delivers full-functioned alternative to MS Visio. ConceptDraw DIAGRAM supports import of Visio files. ConceptDraw DIAGRAM supports flowcharting, swimlane, orgchart, project chart, mind map, decision tree, cause and effect, charts and graphs, and many other diagram types.Quality Control Chart Software — ISO Flowcharting
Quality Control Chart Software (ISO Flowcharting) - ConceptDraw DIAGRAM extended with Total Quality Management TQM Diagrams Solution from the Quality Management Area is the best diagramming and vector drawing software that allows you to draw the quality control charts quick and easy. The quality control chart is a graphic that illustrates the accordance of processes or products to the intended specifications and degree of differences from them. Depending on what type of data you need analyze, there are used different types of quality control charts: X-bar charts, S charts, Np charts.Data Flow Diagram Model
Data Flow Diagram (DFD) is a technique of graphical structural analysis, describing the sources external to the system, recipients of data, also logical functions, data flows and data stores that are accessed. The DFD's goal is to show how each process converts its inputs into the outputs and to identify relationships between these processes, at this make the system's description clear and understandable at every level of detail. Historically happened that for describing Data Flow Diagrams are used two notations - Yourdon and Gane-Sarson that differ each from other by graphical representation of symbols. The DFD model, like most other structural models is a hierarchical model. Each process can be subjected to decomposition on the structural components, the relationships between which in the same notation can be shown on a separate diagram. Typically, several DFD models are built when modeling the system. ConceptDraw DIAGRAM software enhanced with Data Flow Diagrams solution ideally suits for creation DFD models and professional drawing Data Flow Diagrams.Network Diagram Template
Creating of computer network diagrams is a complex process which requires a lot of time and efforts. ConceptDraw DIAGRAM diagramming and vector drawing software was extended with Computer Network Diagrams Solution from the Computer and Networks Area to make your design process easier. One of the most helpful tools of this solution is Network Diagram Template.Basic Diagramming Flowchart Software
ConceptDraw DIAGRAM is a powerful intelligent vector graphics tool for drawing flowcharts.- Diagrama de Topologia | Draw Fishbone Diagram on MAC Software ...
- Diagrama de Topologia | Drawing Software Diagrama De Topologia
- Diagrama de Topologia | AWS Architecture Diagrams | Network ...
- Create Professional Looking Diagrams | Diagrama de Topologia ...
- | Software development with ConceptDraw DIAGRAM | Diagrama de ...
- Safety and Security | Mind Map Making Software | Diagrama de ...
- Network Diagram Software Topology Network | Network Gateway ...
- Diagrama de Topologia | Entity-Relationship Diagram (ERD ...
- Management Tools — Total Quality Management | Diagrama de ...