JSD - Jackson system development
Jackson System Development (JSD) is a linear method of system development created by Michael A. Jackson and John Cameron in the 1980s. It comprises the whole software life cycle directly or providing a framework for more specialized techniques. When implementing the Jackson System Development method and designing JSD diagrams, you can succesfully use the powerful and helpful tools of ConceptDraw PRO software extended with Entity-Relationship Diagram (ERD) solution from the Software Development area of ConceptDraw Solution Park.Structured Systems Analysis and Design Method (SSADM) with ConceptDraw PRO
Structured Systems Analysis and Design Method (abbr. SSADM) is a method developed in Great Britain and accepted in 1993 as a national standard for information systems development and analysis. SSADM is based on Data Flow Diagrams and is characterized with presence of clear sequence of steps at projecting, analysis, and documenting of information system. It involves 6 main stages: analysis of existing system or estimation of practicability, requirements definition, determination of technical requirements and equipment cost, development of logical data model, projecting of logical requirements and specification them, physical projecting. Each of them is also divided into several steps defining the tasks that should be fulfilled at a given stage. The most important SSADM elements are flows modeling with help of DFD, data logic modeling with help of LDS (Logical Data Structure) and description of entities behavior. Applying of SSADM is easy with ConceptDraw PRO diagramming and vector drawing software and Data Flow Diagram solution.SSADM Diagram
The vector stencils library SSADM from the solution Systems engineering contains specific symbols of SSADM diagrams for ConceptDraw PRO diagramming and vector drawing software. The Systems engineering solution is contained in Software Development area of ConceptDraw Solution Park. The example below illustrates the waterfall model used in SSADM. This model involves 5 stages of developing a product such as requirements specification and its' analysis, design, coding and testing.Process Flowchart
The main reason of using Process Flowchart or PFD is to show relations between major parts of the system. Process Flowcharts are used in process engineering and chemical industry where there is a requirement of depicting relationships between major components only and not include minor parts. Process Flowcharts for single unit or multiple units differ in their structure and implementation. ConceptDraw PRO is Professional business process mapping software for making Process flowcharts, Process flow diagram, Workflow diagram, flowcharts and technical illustrations for business documents and also comprehensive visio for mac application. Easier define and document basic work and data flows, financial, production and quality management processes to increase efficiency of your business with ConcepDraw PRO. Business process mapping software with Flowchart Maker ConceptDraw PRO includes extensive drawing tools, rich examples and templates, process flowchart symbols and shape libraries, smart connectors that allow you create the flowcharts of complex processes, process flow diagrams, procedures and information exchange. Process Flowchart Solution is project management workflow tools which is part ConceptDraw Project marketing project management software. Drawing charts, diagrams, and network layouts has long been the monopoly of Microsoft Visio, making Mac users to struggle when needing such visio alternative like visio for mac, it requires only to view features, make a minor edit to, or print a diagram or chart. Thankfully to MS Visio alternative like ConceptDraw PRO software, this is cross-platform charting and business process management tool, now visio alternative for making sort of visio diagram is not a problem anymore however many people still name it business process visio tools.
UML Diagram Types List
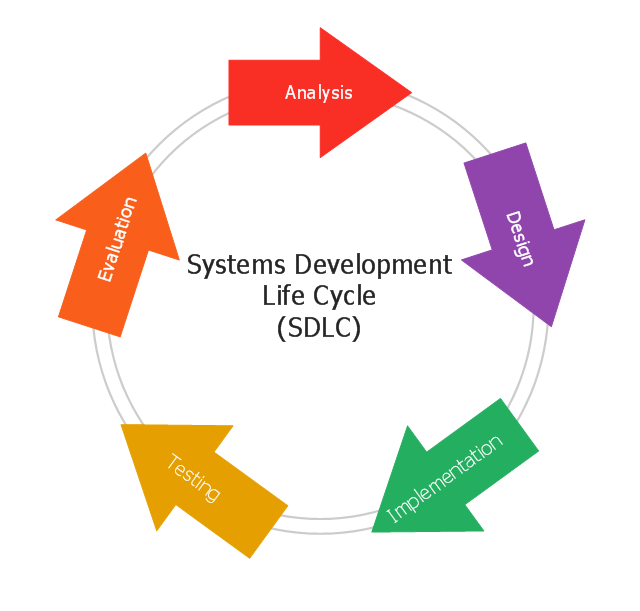
Two types of diagrams are used in UML: Structure Diagrams and Behavior Diagrams. Behavior Diagrams represent the processes proceeding in a modeled environment. Structure Diagrams represent the elements that compose the system.This circular arrows diagram sample shows the systems development life cycle (SDLC) stages.
"The systems development life cycle (SDLC), also referred to as the application development life-cycle, is a term used in systems engineering, information systems and software engineering to describe a process for planning, creating, testing, and deploying an information system. The systems development life-cycle concept applies to a range of hardware and software configurations, as a system can be composed of hardware only, software only, or a combination of both." [Systems development life-cycle. Wikipedia]
The arrow circle diagram example "Systems development life cycle" was created using the ConceptDraw PRO diagramming and vector drawing software extended with the Circular Arrows Diagrams solution from the area "What is a Diagram" of ConceptDraw Solution Park.
UML Activity Diagram
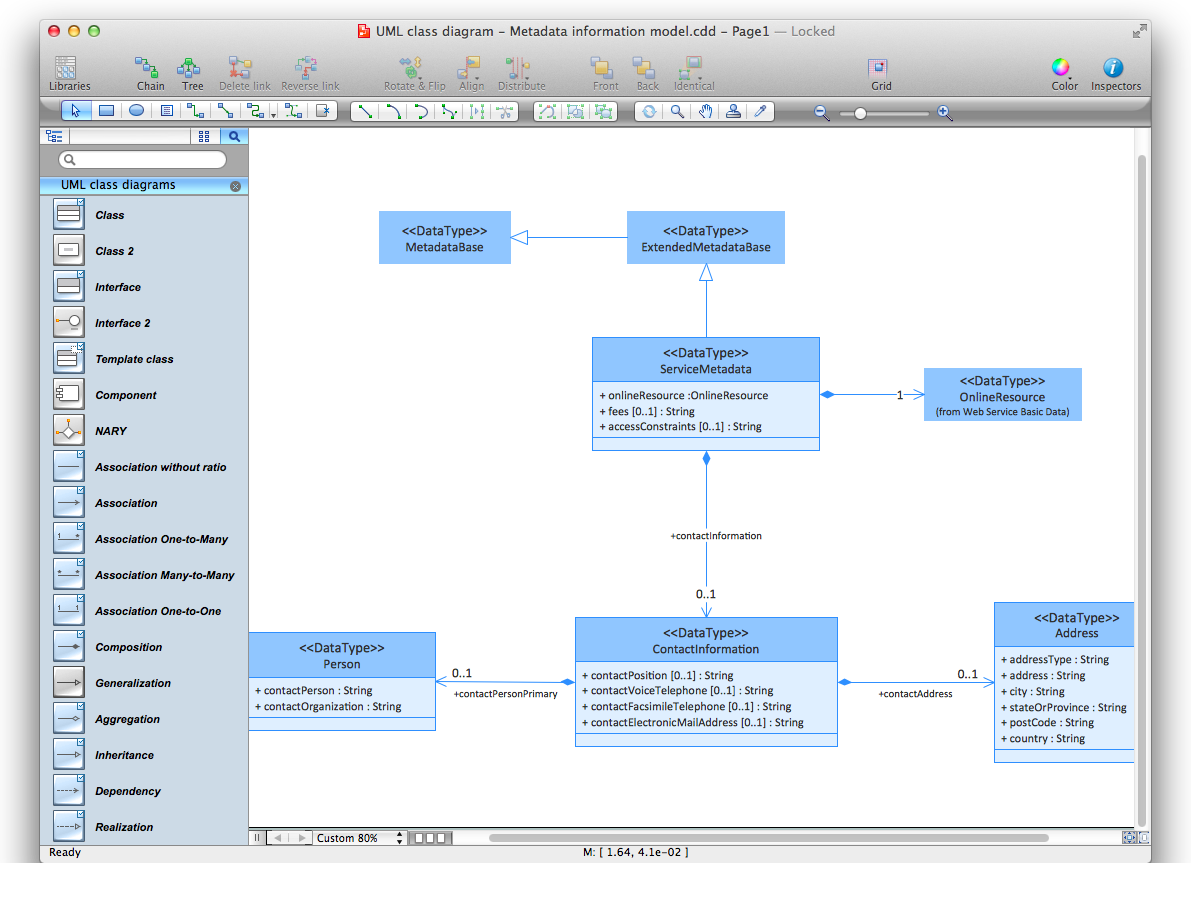
UML Activity Diagram is a type of UML diagrams, which illustrates the business and operational step-by-step workflows of components within a system and shows the overall flow of control. UML Activity Diagram is constructed from a limited number of shapes, connected each other with arrows. The most important shape types are rounded rectangles, diamonds, bars, black circle, encircled black circle. The arrows represent the order in which activities happen and run from the start towards the end. ConceptDraw PRO software enhanced with Rapid UML solution is ideal for software designers and software developers who need to draw the UML Activity Diagrams and other types of UML diagrams. It is convenient to use the appropriate stencils of UML notation from the UML Activity library included to the Rapid UML solution of ConceptDraw Solution Park and containing a lot of specific vector UML objects. Use them to design your own UML Activity Diagrams, make them colorful and attractive with style tools of ConceptDraw PRO software.UML Class Diagrams. Diagramming Software for Design UML Diagrams
In software engineering, a UML Class Diagrams is a type of static structure diagram that is used both for general conceptual modeling of the systematics of the application, and for detailed modeling translating the models into programming code. Use ConceptDraw PRO with UML class diagram templates, samples and stencil library from Rapid UML solution to show the classes of system, their attributes, operations or methods, and the relationships among the classes.
UML Use Case Diagram Example. Services UML Diagram. ATM system
Services UML Diagram. ATM system. This sample was created in ConceptDraw PRO diagramming and vector drawing software using the UML Use Case Diagram library of the Rapid UML Solution from the Software Development area of ConceptDraw Solution Park. This sample shows the scheme of the servicing using the ATMs (Automated Teller Machines) and is used at the working of ATM banking systems, at the performing of the banking transactions.Diagramming Software for designing UML Sequence Diagrams
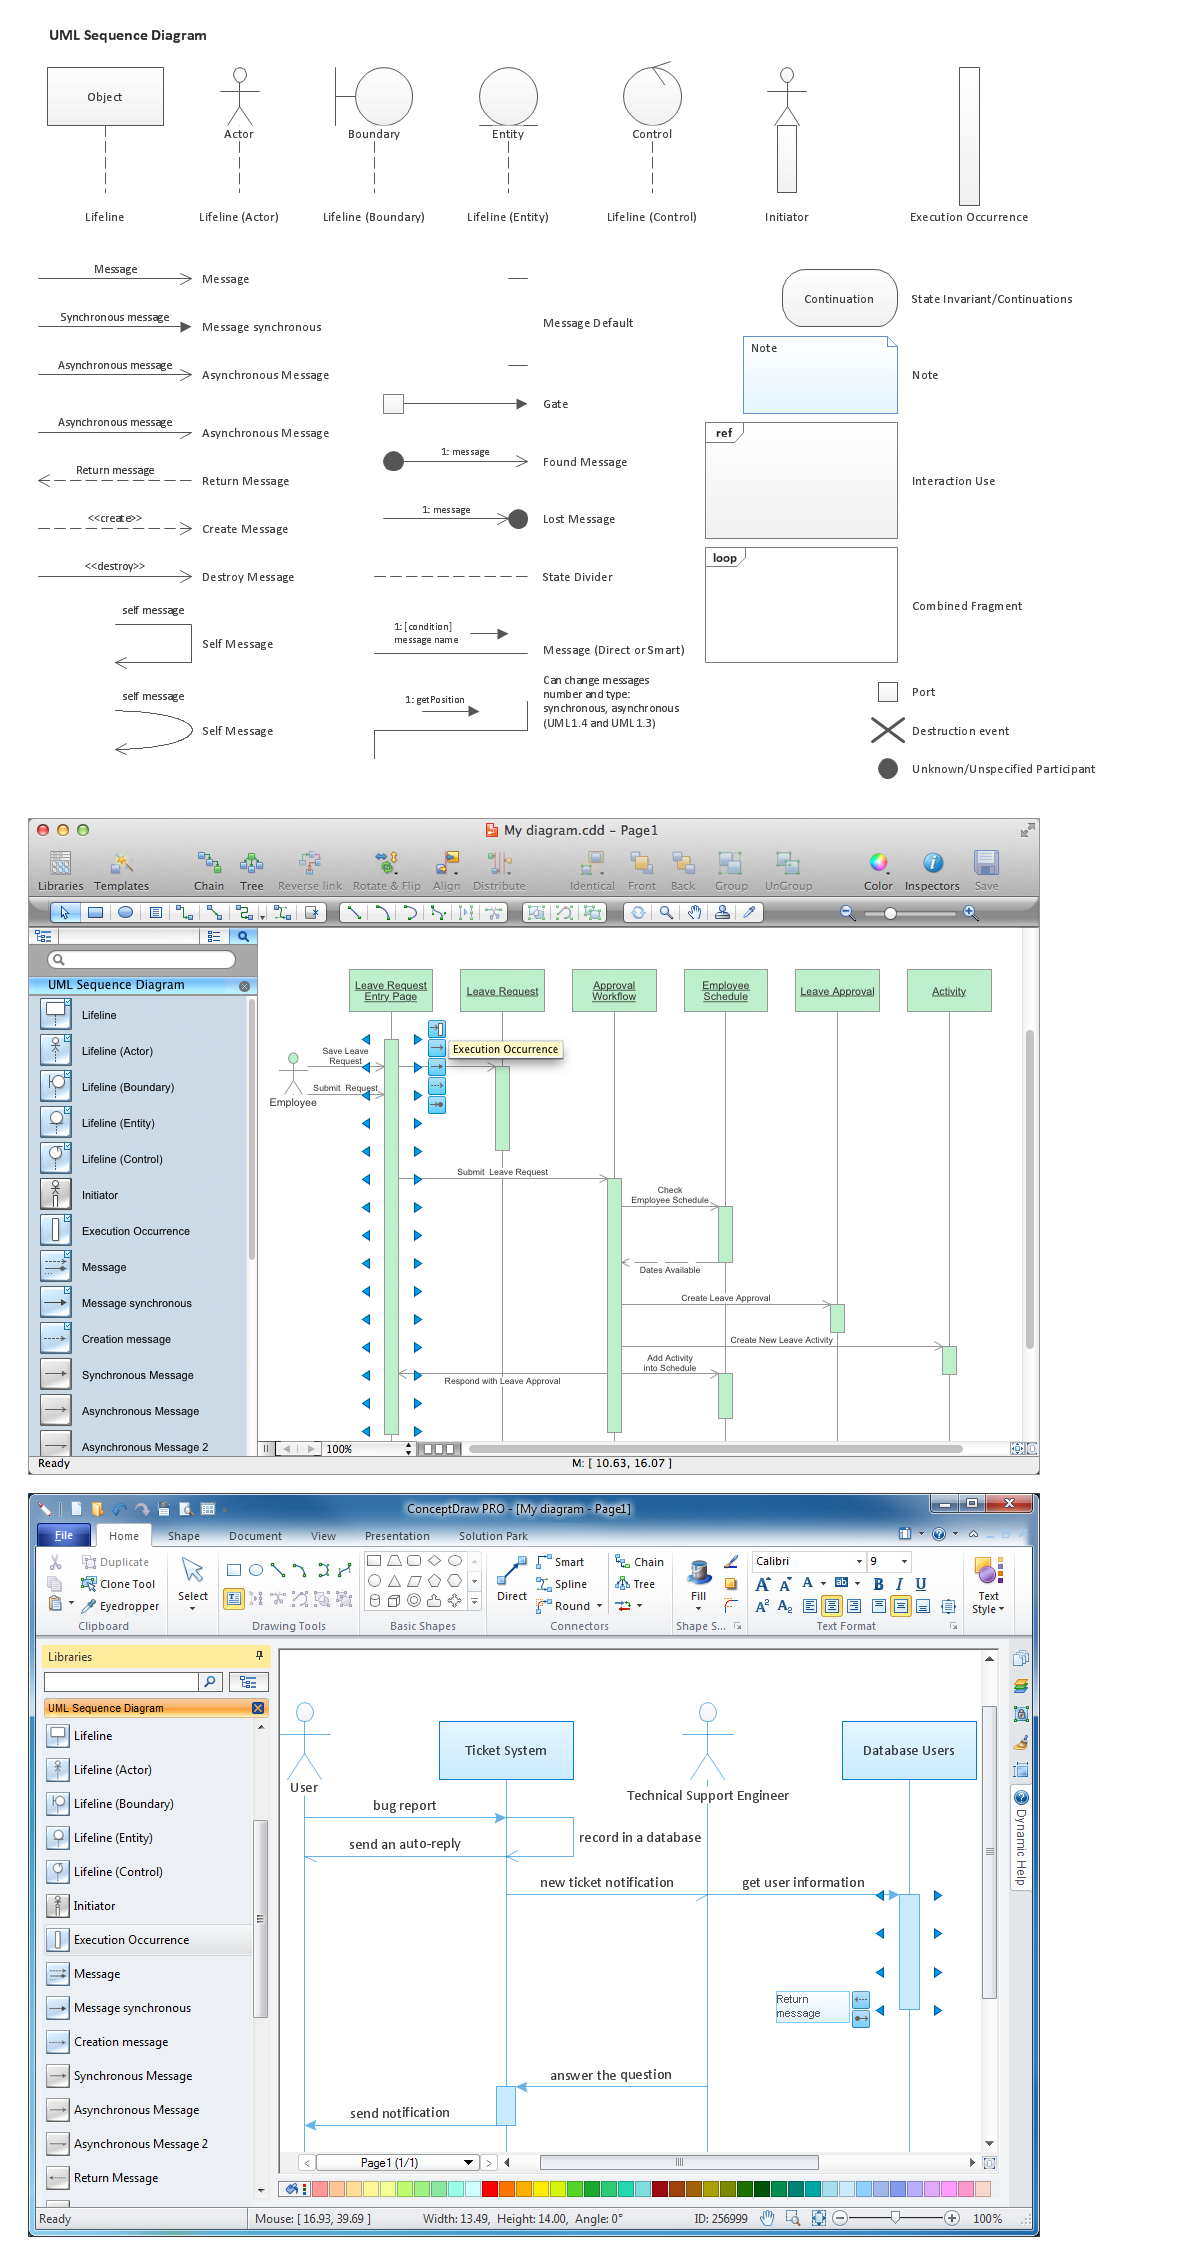
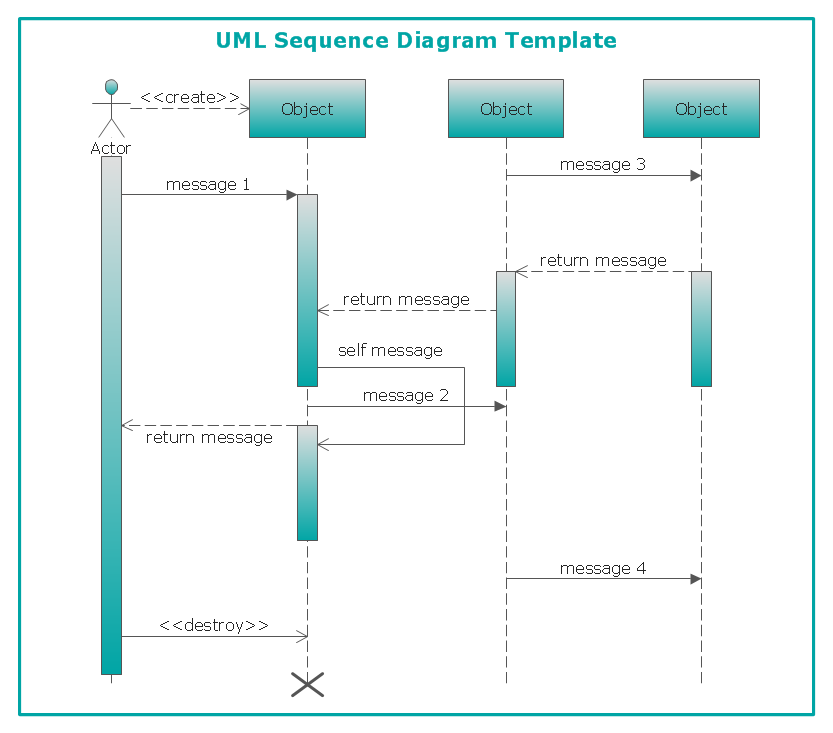
Sequence Diagrams shows how objects communicate with each other in terms of a sequence of messages. Also indicates the lifespans of objects relative to those messages.
UML Deployment Diagram
UML Deployment Diagram depicts the physical deployment of artifacts on nodes (nodes are the existing hardware components, artifacts are the software components running on each node); and how the different pieces are connected. Use ConceptDraw PRO with UML deployment diagram templates, samples and stencil library from Rapid UML solution to model the physical deployment of artifacts on nodes of your software system.
UML Sequence Diagram
UML Sequence Diagram can be created using ConceptDraw PRO diagramming software contains rich examples and template. ConceptDraw is perfect for software designers and software developers who need to draw UML Sequence Diagrams.
Data Flow Diagram (DFD)
A Data Flow Diagram (DFD) illustrates the flow of data through an information system, visualizes how the information is handled in terms of inputs and outputs, how the data enter to system and leave it. It is effective to use a Data Flow Diagram for creation the system's overview, to show the system's scope and boundaries. There are two different types of notations for DFDs: Yourdon-Coad and Gane-Sarson, which differ in visual representations for processes, data flow, data stores, external entities, etc. Thus, for example the processes are depicted as circles in Yourdon-Coad notation and as rounded squares in Gane-Sarson notation. Gane-Sarson notation is usually used for visualization information systems and Yourdon-Coad - for system analysis and design. The Data Flow Diagrams solution included to Software Development area of ConceptDraw Solution Park offers a lot of DFD templates, samples and examples, libraries of vector stencils for construction without efforts the DFDs according to both Gane-Sarson and Yourdon-Coad notations.Diagramming Software for Design UML Interaction Overview Diagrams
UML Interaction Overview Diagram schematically shows a control flow with nodes and a sequence of activities that can contain interaction or sequence diagrams.
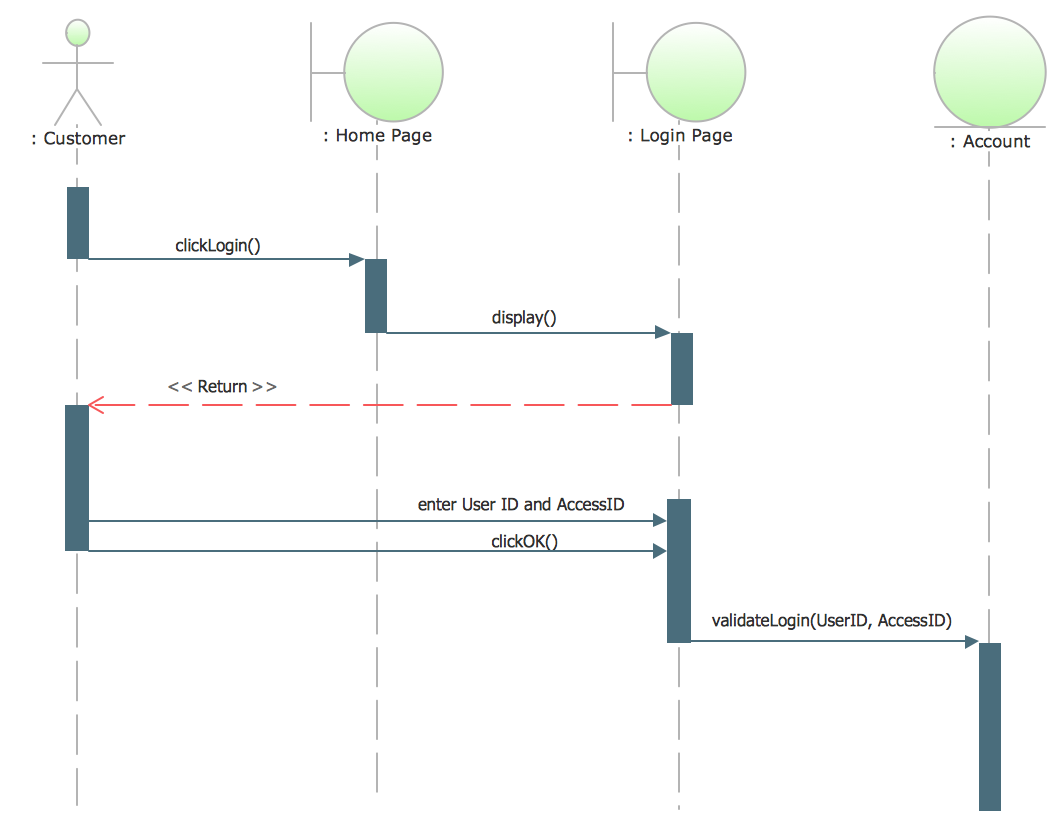
UML Sequence Diagram Example. SVG Vectored UML Diagrams Tools
This sample was created in ConceptDraw PRO diagramming and vector drawing software using the UML Sequence Diagram library of the Rapid UML Solution from the Software Development area of ConceptDraw Solution Park. This sample shows the interactions of the customer with the system and is used at the registration on the sites.- Systems development life cycle | SSADM Diagram | Process ...
- JSD - Jackson system development | Systems development life ...
- Draw The Diagram Of The System Development Cycle
- Systems development life cycle | SSADM Diagram | Structured ...
- 4 Level pyramid model diagram - Information systems types ...
- Ishikawa Diagram For System Development
- Diagram Of System Development Life Circle
- Circular Flow Diagram Template | Systems development life cycle ...
- Systems development life cycle | Circular Flow Diagram Template ...
- Structured Systems Analysis and Design Method (SSADM) with ...
- ConceptDraw PRO ER Diagram Tool | JSD - Jackson system ...
- Development Cycle Diagram
- JSD - Jackson system development | Components of ER Diagram ...
- JSD - Jackson system development | UML Class Diagram Example ...
- Draw Diagram Of Information System Development Cycle
- Systems development life cycle | SSADM Diagram | Circular Flow ...
- Data Flow Diagram Process | DFD - Process of account receivable ...
- Jacobson Use Cases Diagram | JSD - Jackson system development ...
- Process Flowchart | Systems development life cycle | Circular Flow ...
- Software Development Flow Diagram


