Sentence Diagrammer
Sentence a grammatical unit of several words, and provides a narrative, question, comment, etc. It begins with a capital letter and ends with proper punctuation. Sentence diagramming allows you to visually present the sentence part function, which helps you build right sentences. Language Learning solution offers the Sentence Diagrams Library with set of vector stencils for drawing various Sentence Diagrams, for visualizing grammatical structures that will assist you in language learning and construction of grammatically correct sentences. ConceptDraw DIAGRAM diagramming software extended with Language Learning solution from the Science and Education area provides the powerful sentence diagraming tools.Venn Diagram Examples for Problem Solving. Computer Science. Chomsky Hierarchy
A Venn diagram, sometimes referred to as a set diagram, is a diagramming style used to show all the possible logical relations between a finite amount of sets. In mathematical terms, a set is a collection of distinct objects gathered together into a group, which can then itself be termed as a single object. Venn diagrams represent these objects on a page as circles or ellipses, and their placement in relation to each other describes the relationships between them. The Venn diagram example below visualizes the the class of language inclusions described by the Chomsky hierarchy.Basic Flowchart Symbols and Meaning
Flowcharts are the best for visually representation the business processes and the flow of a custom-order process through various departments within an organization. ConceptDraw DIAGRAM diagramming and vector drawing software extended with Flowcharts solution offers the full set of predesigned basic flowchart symbols which are gathered at two libraries: Flowchart and Flowcharts Rapid Draw. Among them are: process, terminator, decision, data, document, display, manual loop, and many other specific symbols. The meaning for each symbol offered by ConceptDraw gives the presentation about their proposed use in professional Flowcharts for business and technical processes, software algorithms, well-developed structures of web sites, Workflow diagrams, Process flow diagram and correlation in developing on-line instructional projects or business process system. Use of ready flow chart symbols in diagrams is incredibly useful - you need simply drag desired from the libraries to your document and arrange them in required order. There are a few serious alternatives to Visio for Mac, one of them is ConceptDraw DIAGRAM. It is one of the main contender with the most similar features and capabilities.
What Is a Concept Map
What is a Concept Map and what software is effective for its design? A concept map or conceptual diagram is a diagram that depicts suggested relationships between concepts. As for effective software - we suggest you to pay attention for the ConceptDraw DIAGRAM diagramming and vector drawing software. Extended with Concept Maps Solution from the "Diagrams" Area it is a real godsend for you.Venn Diagram Examples for Problem Solving. Computer Science. Chomsky Hierarchy
A Venn diagram, sometimes referred to as a set diagram, is a diagramming style used to show all the possible logical relations between a finite amount of sets. In mathematical terms, a set is a collection of distinct objects gathered together into a group, which can then itself be termed as a single object. Venn diagrams represent these objects on a page as circles or ellipses, and their placement in relation to each other describes the relationships between them. The Venn diagram example below visualizes the the class of language inclusions described by the Chomsky hierarchy.
Business Process Mapping
The Business Process Mapping solution for ConceptDraw DIAGRAM is for users involved in process mapping and creating SIPOC diagrams.
Venn Diagrams
Venn Diagrams are actively used to illustrate simple set relationships in set theory and probability theory, logic and statistics, mathematics and computer science, linguistics, sociology, and marketing. Venn Diagrams are also often used to visually summarize the status and future viability of a project.
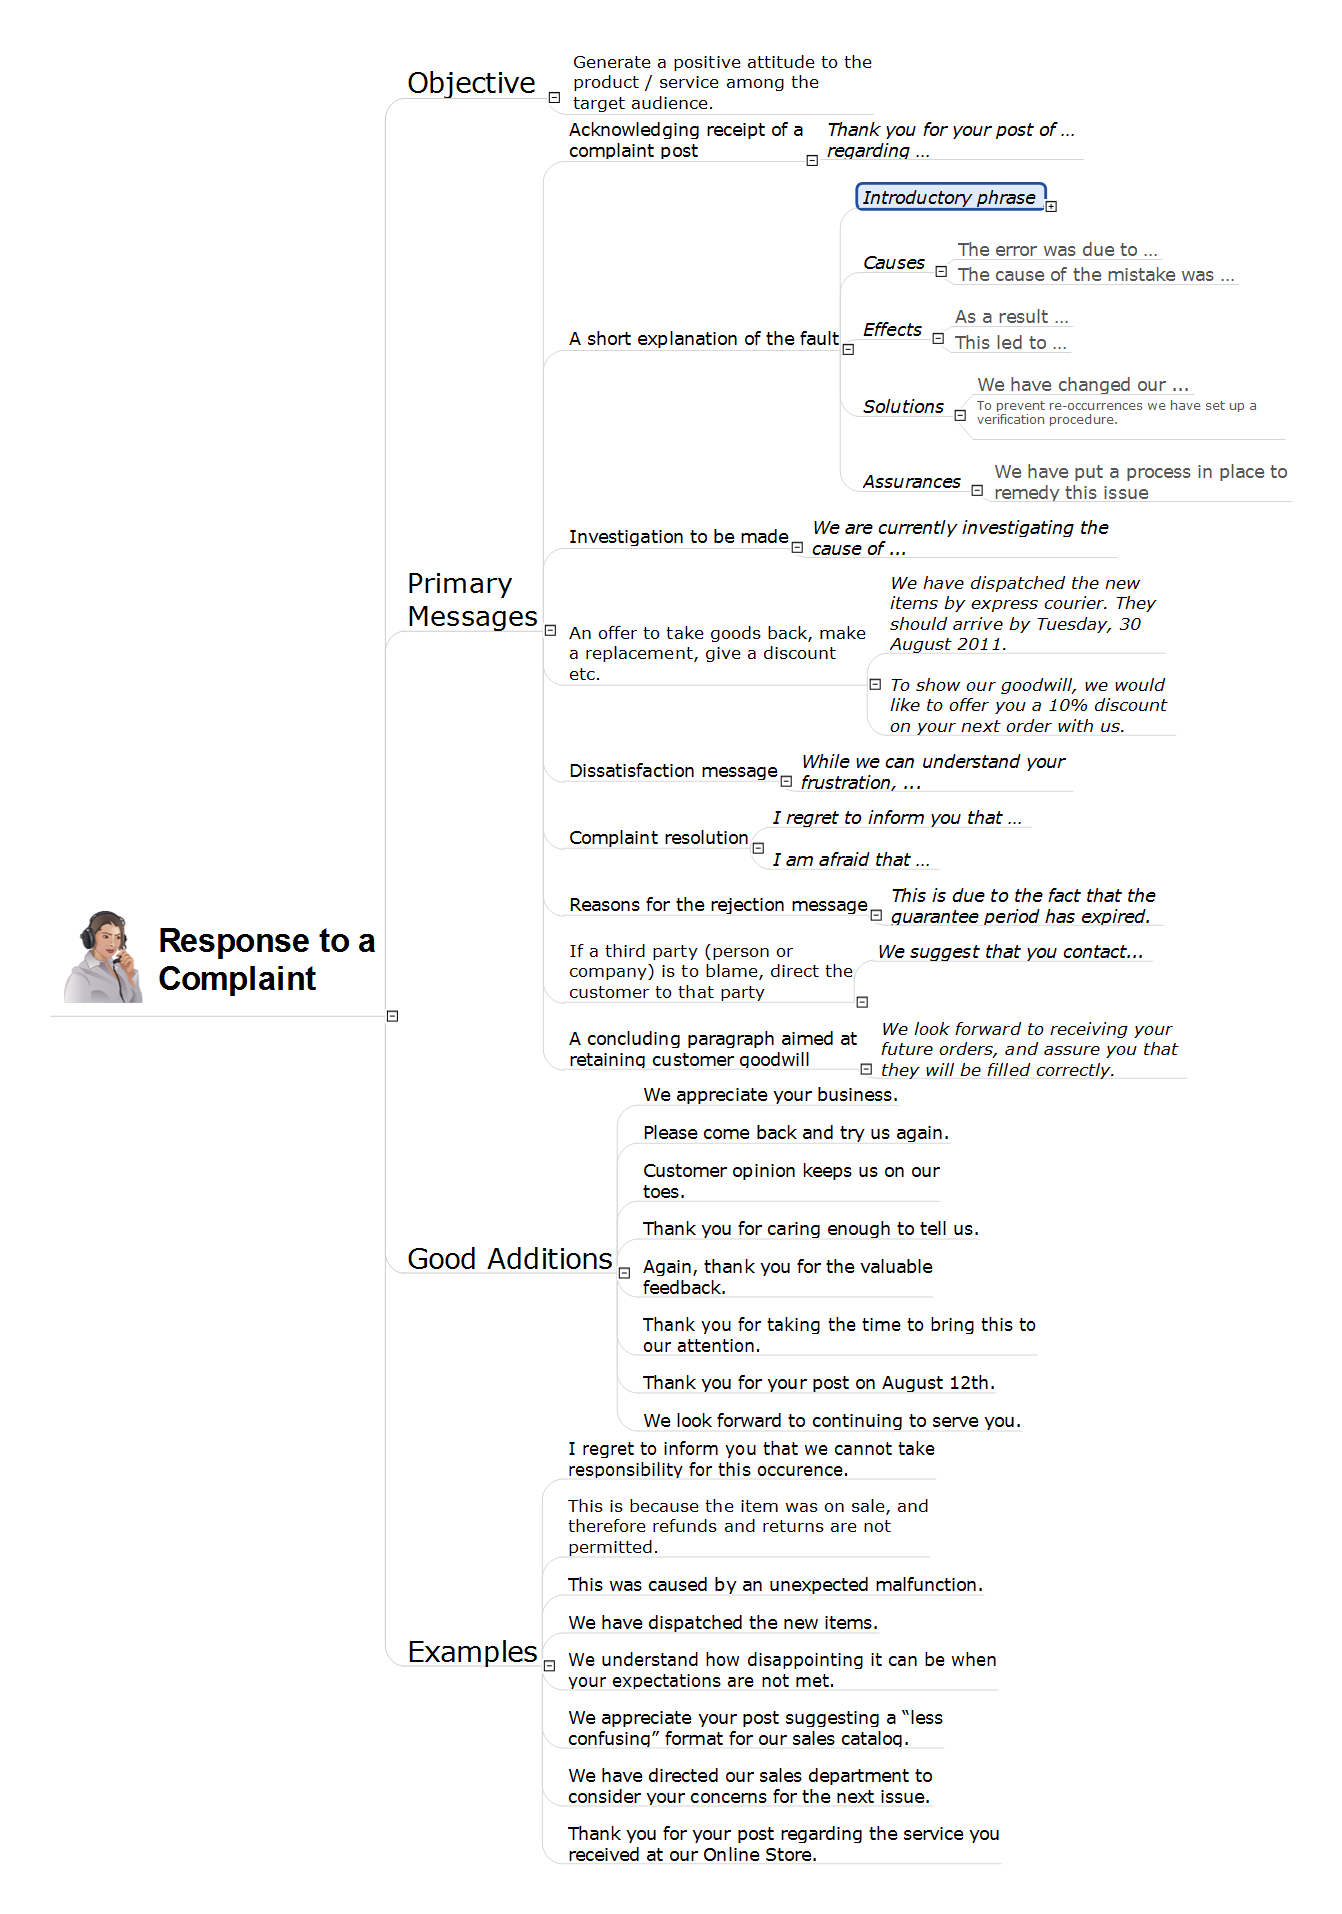