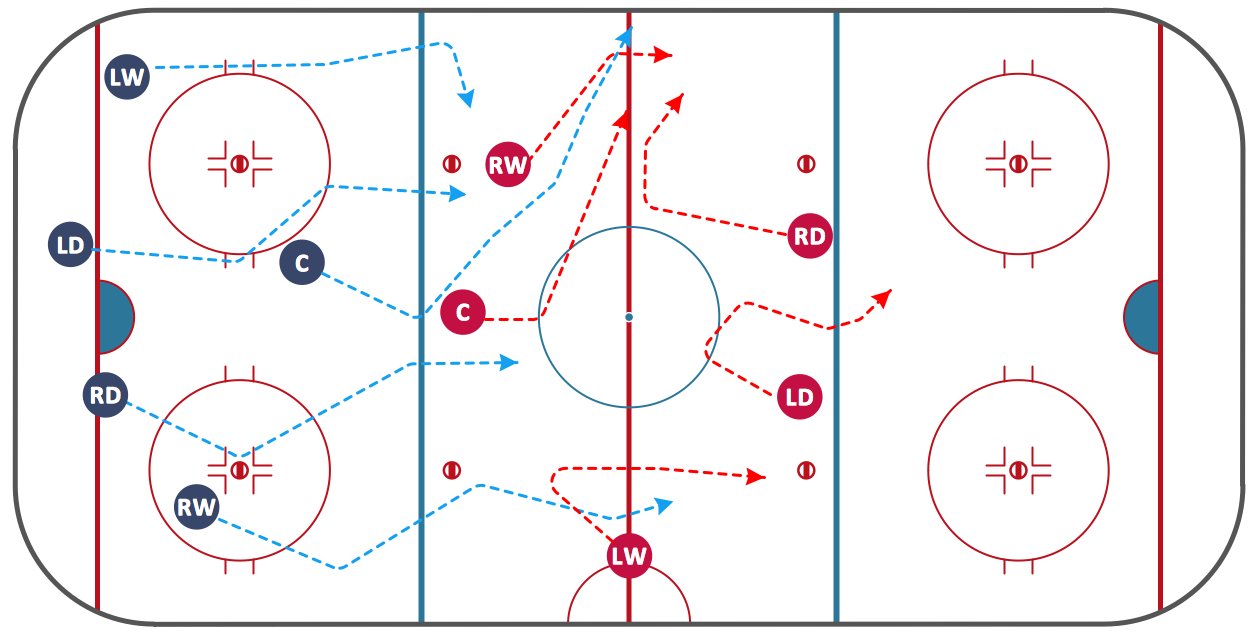
Ice Hockey Diagram — Defensive Strategy — Neutral Zone Trap
In ConceptDraw DIAGRAM you can produce ice hockey diagrams of any complexity for any presentaion needs, using a combination of tools. To adopt the sample below for presentation needs place positions and arrows onto different layers of your document and then make them visible one by one during a presentation.Remote Projects in Corporate Strategy
Communication is the main challenge and the key success factor for organizational project management in company with remote projects. Communicating visually via Skype you bring all projects together to achieve corporate goals.
SWOT Analysis Solution - Strategy Tools
The condition and successful development of the company depends on how efficiently it is able to react on different outside influences. Analysis and interrelated consideration of external factors and the company's capabilities allow effectively solve appearing problems. One of the most common methods of evaluation together internal and external factors influencing the company's development is SWOT analysis elaborated for business and industry. It is a necessary element of researches and obligatory preliminary stage at the preparation of strategic and marketing plans of the company. Upon the results of SWOT analysis, we can assess does the company have the internal forces and resources to realize the existing opportunities and resist external threats, and what internal deficiencies require the prompt rectification. ConceptDraw DIAGRAM software enhanced with SWOT Analysis solution offers powerful drawing and strategy tools for effective execution the SWOT and TOWS analysis for your company with a goal of effectively realizing strategic planning and correct decision-making.Successful Strategic Plan
This sample shows the Strategic Plan of the Broadband Lifecycle that was developed by Strategic Networks Group. The Broadband Lifecycle represents the advance of the broadband investments.Competitor Analysis
Competitor analysis is a first and obligatory step in elaboration the proper corporate marketing strategy and creating sustainable competitive advantage. Use powerful opportunities of numerous solutions from ConceptDraw Solution Park for designing illustrative diagrams, charts, matrices which are necessary for effective competitor analysis.Example of Organizational Chart
Example of Organizational Chart - Lots of organization chart examples created by ConceptDraw Organizational Chart Software. Include company organizational chart, hospital organizational chart, hotel Organizational chart, corporate organizational chart samples etc
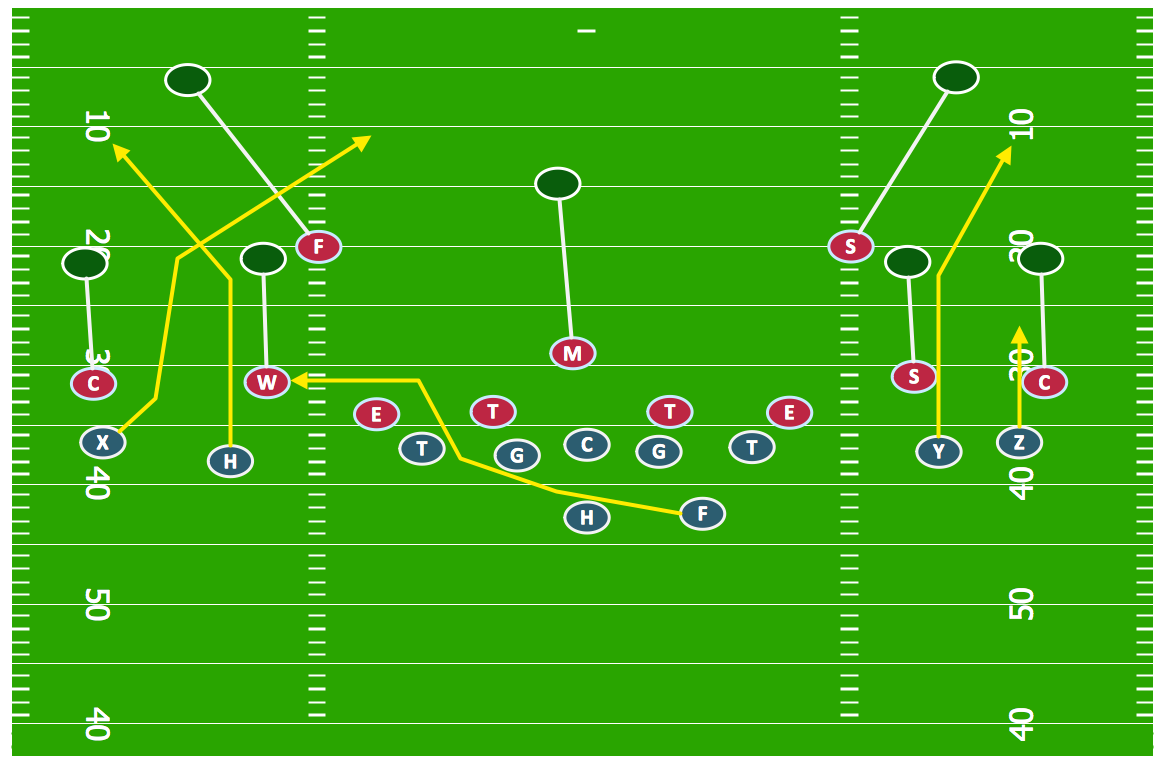
Offensive Strategy — Spread Offense Diagram
Explaining offensive strategies of American Football is practically impossible without drawing a diagram. If you need to do this more than once you have to choose an appropriate tool allows you to change diagrams easily. ConceptDraw DIAGRAM extended with the Football Solution is the best choice for this case.Pyramid Chart Examples
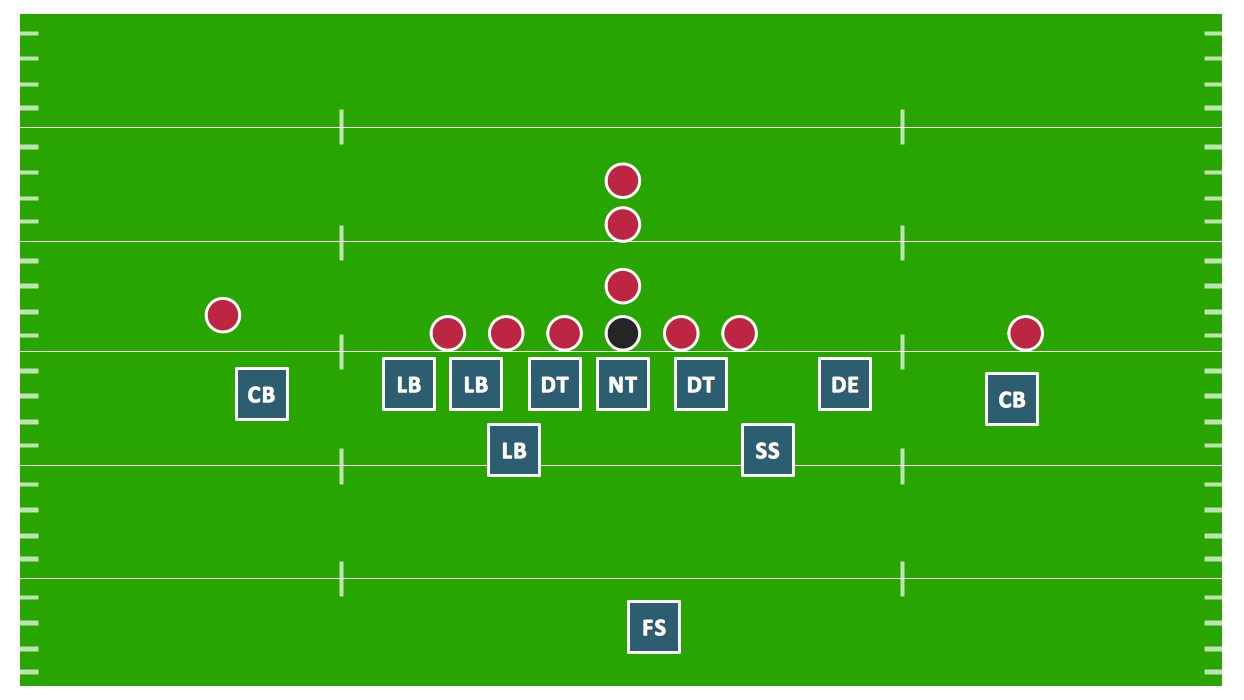
Pyramid Charts and Triangle Diagrams are used to visually structure the topics and progressively order the quantitative data. They allow to illustrate hierarchical structure of the topics, proportional, interconnected and containment relations among the topics. The multilevel Pyramids and Triangle diagrams are constructed oriented up or down and divided into several horizontal slices. They are effectively used to represent marketing strategies, social strategies, information systems, market value, etc., to illustrate presentations, websites, documents, reports in business, finances, sales, management, marketing, media, training, consulting, and many other fields. To maximize the efficiency in drawing the Pyramid Charts, use the ConceptDraw DIAGRAM diagramming and vector drawing software extended with Pyramid Diagrams solution from Marketing area, which contains the set of Pyramid Chart examples, samples, templates and vector design elements of triangular diagrams and pyramids with different quantity of levels for various needs.Defensive Strategy Diagram – 46 Defence
Drawing defensive strategy diagrams using ConceptDraw DIAGRAM software extended with the Football solution saves your time, and adds more value to your work. You can easily convert vector drawing to a popular graphic format and then post it to your blog or site. There is no problem to add your logo or text copyright, or use some text comments to make your diagrams unique and recognizable.
 Business Process Diagrams
Business Process Diagrams solution extends the ConceptDraw DIAGRAM BPM software with RapidDraw interface, templates, samples and numerous libraries based on the BPMN 1.2 and BPMN 2.0 standards, which give you the possibility to visualize equally easy simple and complex processes, to design business models, to quickly develop and document in details any business processes on the stages of project’s planning and implementation.
SWOT Analysis
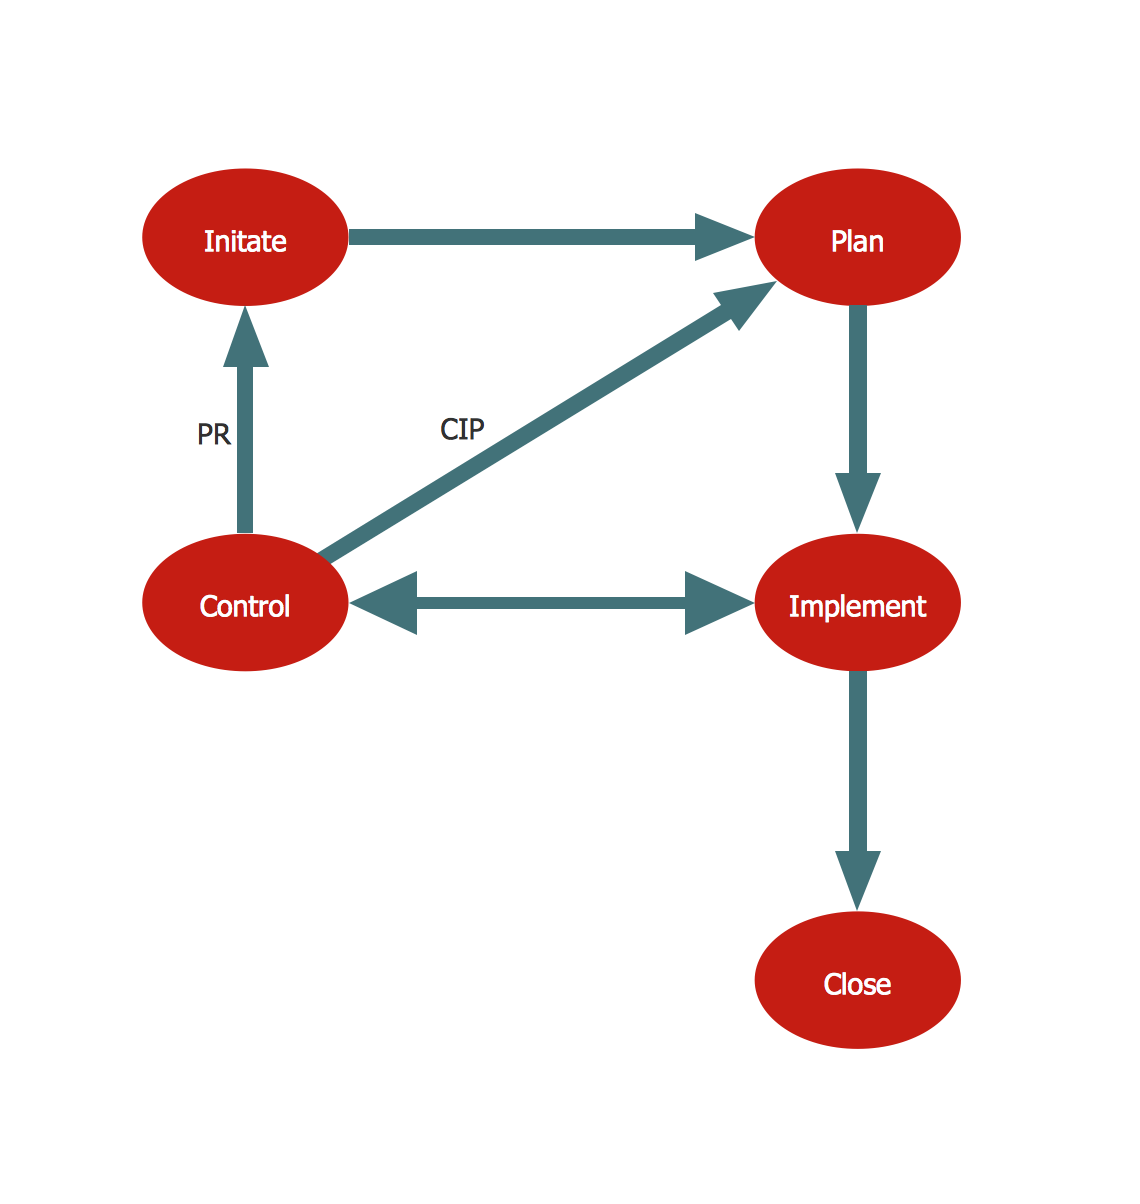
Most of the data needed for market analysis (demand, prices, volume of sales, etc.) are undefined, and in future are possible their changes as in the worst and the best side. SWOT analysis is effective method for prediction these processes and decision making for organizations that function in a competitive environment. It allows you to see the whole situation, to identify the strengths and weaknesses of organization (advantages and disadvantages), as well as opportunities and threats of external environment. The results of SWOT analysis are the basis for optimization the business processes, for development by the leading specialists in organization of interrelated complex of strategies and competitive activities. ConceptDraw DIAGRAM software enhanced with SWOT and TOWS Matrix Diagrams Solution will effectively help you in strategic planning for your company, department, project, in development marketing campaign, in identification of four categories of factors of internal and external environment of organization, and construction professional-looking SWOT and TOWS matrices.Business Process Reengineering. Business Process Example
This sample shows the Business Process Reengineering Diagram, displays the Continuous Improvement Process (CIP) directed at the permanent improvement of the processes. This sample can be used in business process management, quality management, project management and program management.SWOT Sample in Computers
SWOT analysis is an effective method of making the plan for evaluation the Strengths, Weaknesses, Opportunities, and Threats that are involved in a project. It is actively applied in business sphere and helps define the objective of the project. It lets detect and represent the external and internal causes for the accomplishing the project goals and business purposes, and also plays important role in formation successful and perspective business. ConceptDraw DIAGRAM is a perfect diagramming software which nicely suits for SWOT analysis and representation its results in the form of SWOT diagrams of different complexity and design, thanks to the included SWOT and TOWS Matrix Diagrams solution from Management area of ConceptDraw Solution Park. This solution contains a lot of specially designed SWOT templates, SWOT matrix samples (SWOT analysis sample, SWOT sample in computers, SWOT matrix for business sphere, SWOT matrix educational, and many others), and also ready SWOT matrix objects that allow users create their own SWOT diagrams in minutes.BPR Diagram. Business Process Reengineering Example
This sample was created in ConceptDraw DIAGRAM diagramming and vector drawing software using the Business Process Diagram Solution from the Business Processes area of ConceptDraw Solution Park. The Business Process Solution is based on the standard BPMN 2.0 and includes the set of libraries of ready-to-use objects.Business Process Workflow Diagram
Business Process Workflow Diagram is a professional visual tool that is widely applied for business development, business analysis, business process optimization and documenting business processes. Business Process Workflow Diagram lets depict in details the steps of business processes and flow of tasks between them, the execution of business processes, transfer of data and documents. The workflows on the Business Process Workflow Diagram are represented using the set of common symbols which let easy illustrate business processes and process flows, depict the start, all major steps and end of the process, what data are used by the process, how the data flow through the business areas within scope of our project, how the tasks are executed and by who, and how workers interact with each other.
- Remote Projects in Corporate Strategy | How to show a mind map ...
- Diagram For Business Strategy Project Management
- Pyramid Chart Examples | Ice Hockey Diagram – Defensive Strategy ...
- Draw An Example Of A Corporate Strategy
- Business Strategy Planning Chart
- Business Strategy Diagram
- Strategy Business
- Diagram Strategy Map
- Examples Of Business And It Strategy
- Planning A Business Strategy
- Corporate Strategy Basics
- Business Strategy Chart Templates
- Business Strategy Diagrams
- Draw Diagram Illustrating Strategic Project Planning
- Business Process Strategy
- Remote Projects in Corporate Strategy | Build Strategies ...
- Diagram On Business Strategic
- Mindmap Business Strategy Change
- Remote Projects in Corporate Strategy | Build Strategies ...


