HelpDesk
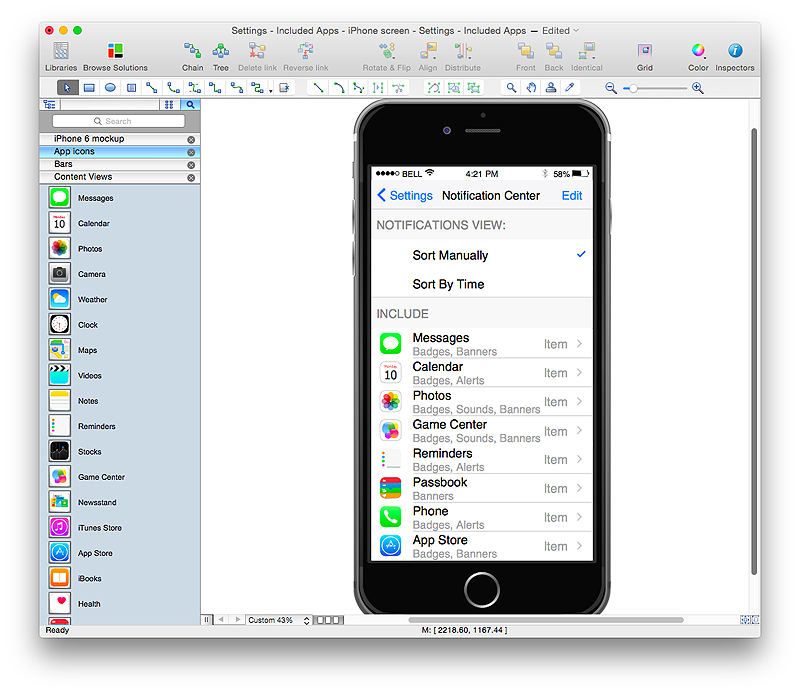
How to Design an Interface Mockup for iPhone Application in ConceptDraw PRO
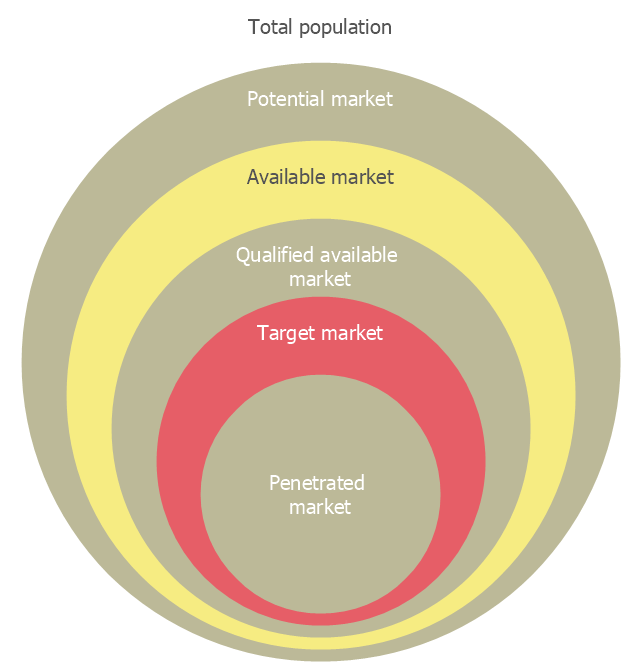
The Apple iPhone user interface has become something of a standard for smartphones, and mobile devices in general. A well designed user interface (UI) is very important for user-friendly navigation and best correlation with operating system logic. Development of successful iPhone App UI requires a planning and prototyping stage. An iPhone UI diagram can be employed to give a general view of the device's screen, upon which elements can be placed and re-arranged as necessary. Using ConceptDraw PRO you can mock-up an iPhone UI system so that you can figure out how best to represent user interface (UI) elements for the development of a new iPhone App."A target market is a group of customers that the business has decided to aim its marketing efforts and ultimately its merchandise towards. A well-defined target market is the first element to a marketing strategy. The marketing mix variables of product, place (distribution), promotion and price are the four elements of a marketing mix strategy that determine the success of a product in the marketplace." [Target market. Wikipedia]
"An onion diagram is a kind of chart that shows the dependencies among parts of an organization or process. The chart displays items in concentric circles, where the items in each ring depend on the items in the smaller rings. ...
The Onion Diagram is able to show layers of a complete system in a few circles. Each of the circles is able to represent a component that is dependent upon the component on the inside of it shown by the circle inside of it. The main concept of the diagram is shown by the center circle of the diagram. This chart is used due to the fact that it has a clear visual representation that is easy to read, and it has a strong visual impact." [Onion diagram. Wikipedia]
This onion diagram (target diagram) example "Target market" was created using the ConceptDraw PRO diagramming and vector drawing software extended with the Target and Circular Diagrams solution from the Marketing area of ConceptDraw Solution Park.
www.conceptdraw.com/ solution-park/ marketing-target-and-circular-diagrams
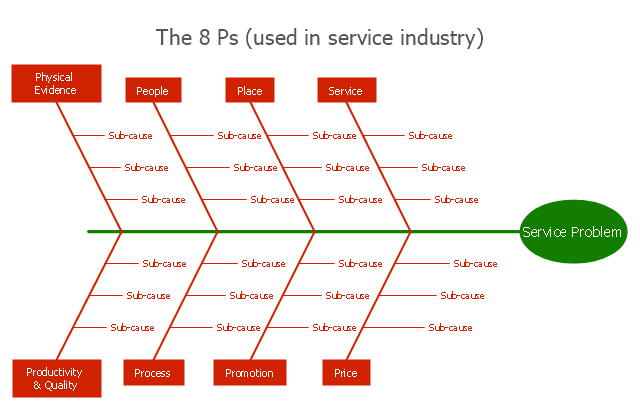
"Causes in the diagram are often categorized, such as to ...
The 7 Ps (used in marketing industry):
(1) Product/ Service;
(2) Price;
(3) Place;
(4) Promotion;
(5) People/ personnel;
(6) Positioning;
(7) Packaging. " [Ishikawa diagram. Wikipedia]
This 8 Ps Ishikawa diagram (service cause and effect diagram) template is included in the Fishbone Diagram solution from the Management area of ConceptDraw Solution Park.
 Circle-Spoke Diagrams
Examples of subject areas that are well suited to this approach are marketing, business, products promotion, process modeling, market, resource, time, and cost analysis. Circle-Spoke Diagrams are successfully used in presentations, conferences, management documents, magazines, reportages, reviews, reports, TV, and social media.
- Diagram On Promotion Mix
- Marketing Diagrams | Competitor Analysis | Marketing mix - Wheel ...
- Marketing Diagrams | Target market | Competitor Analysis ...
- Marketing mix - Wheel diagram | Marketing Diagrams | Target ...
- Promotion Mix Diagram
- Diagram Of Promotional Software
- Marketing mix - Wheel diagram | Target market | Competitor Analysis ...
- Marketing Diagrams | Six Elements Of Promotion Mix Diagram
- Marketing Diagrams | Competitor Analysis | How to Connect Social ...


