Mathematical Diagrams

Basic Flowchart Symbols and Meaning


HelpDesk
How to Draw Geometric Shapes in ConceptDraw PRO

Mathematics Symbols

The vector stencils library "Cloud shapes" contains 69 geometric shapes.
Use it to design your cloud computing diagrams and infographics with ConceptDraw PRO software.
"The essence of a diagram can be seen as: ...
- with building blocks such as geometrical shapes connected by lines, arrows, or other visual links." [Diagram. Wikipedia]
The geometric shapes example "Design elements - Cloud shapes" is included in the Cloud Computing Diagrams solution from the Computer and Networks area from ConceptDraw Solution Park.
Geometric shapes for cloud computing diagrams
 Mathematics
Mathematics solution extends ConceptDraw PRO software with templates, samples and libraries of vector stencils for drawing the mathematical illustrations, diagrams and charts.
ER Diagram Styles

How To Create Onion Diagram

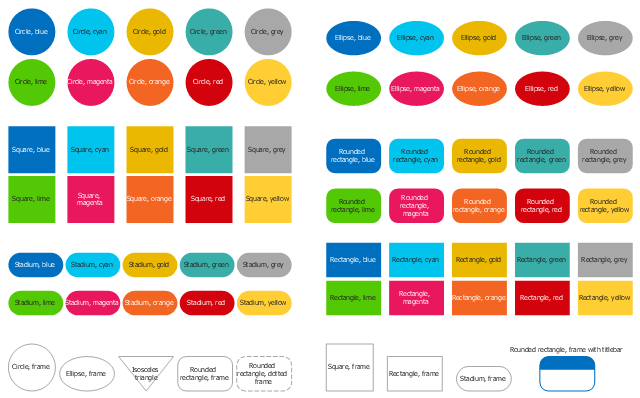
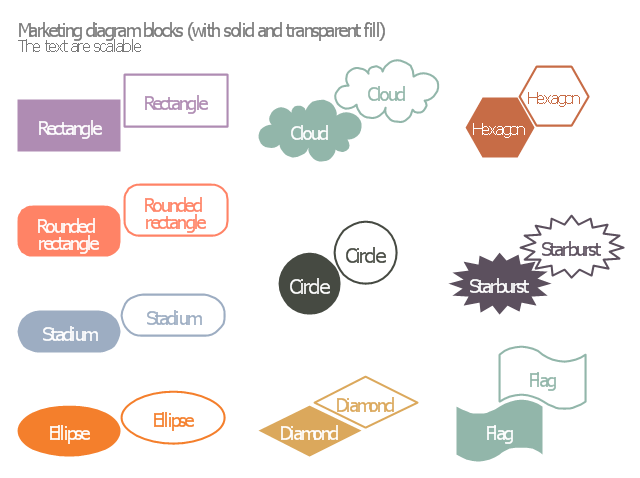
The vector stencils library "Marketing diagram" contains 20 solid and transparent geometric shapes: rectangle, rounded rectangle, ellipse, cloud, circle, diamond, hexagon, starburst, flag.
Use it to illustrate your marketing infograms with block diagrams.
"The term diagram in its commonly used sense can have a general or specific meaning:
(1) visual information device: Like the term "illustration" the diagram is used as a collective term standing for the whole class of technical genres, including graphs, technical drawings and tables.
(2) specific kind of visual display: This is the genre that shows qualitative data with shapes that are connected by lines, arrows, or other visual links. ...
In the specific sense diagrams and charts contrast with computer graphics, technical illustrations, infographics, maps, and technical drawings, by showing "abstract rather than literal representations of information". The essence of a diagram can be seen as:
(1) a form of visual formatting devices;
(2) a display that does not show quantitative data (numerical data), but rather relationships and abstract information;
(3) with building blocks such as geometrical shapes connected by lines, arrows, or other visual links." [Diagram. Wikipedia]
The shapes example "Design elements - Marketing diagram" was created using the ConceptDraw PRO diagramming and vector drawing software extended with the Marketing Infographics solition from the area "Business Infographics" in ConceptDraw Solution Park.
Diagram building blocks
Draw Fishbone Diagram on MAC Software

- How to Draw Geometric Shapes in ConceptDraw PRO ...
- How to Draw Geometric Shapes in ConceptDraw PRO | Design ...
- Mathematical Diagrams | How to Draw Geometric Shapes in ...
- How to Draw Geometric Shapes in ConceptDraw PRO | Solid ...
- How to Draw Geometric Shapes in ConceptDraw PRO ...
- Mathematical Diagrams | Mathematics Symbols | Basic Flowchart ...
- Mathematics Symbols | How to Draw Geometric Shapes in ...
- Design elements - Cloud shapes | How to Draw Geometric Shapes ...
- Mathematics Symbols | Mathematical Diagrams | How to Draw ...
- Ice Hockey | Basic Diagrams Of Geometry With Names