

Fully Connected Network Topology Diagram

 Concept Maps
The technique of concept mapping was developed as a constructive way of representing knowledge in science and increasing the meaningfulness of learning. Now, the creation of a concept map is extremely helpful when used in education as learning and teaching techniques that assist memorization. Concept maps are also used for idea generation in brainstorming sessions, and for detailing the structure of complex ideas.
Cross-Functional Flowchart


Pyramid Diagram

"Problem-solving consists of using generic or ad hoc methods, in an orderly manner, for finding solutions to problems. Some of the problem-solving techniques developed and used in artificial intelligence, computer science, engineering, mathematics, medicine, etc. are related to mental problem-solving techniques studied in psychology." [Problem solving. Wikipedia]
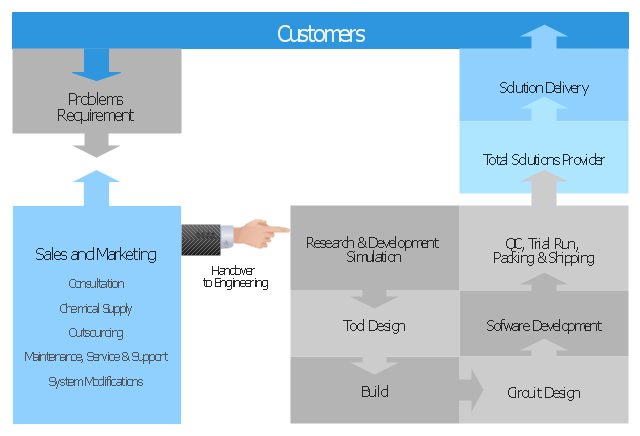
The block diagram example "Total solution process" was created using the ConceptDraw PRO diagramming and vector drawing software extended with the Block Diagrams solution from the area "What is a Diagram" of ConceptDraw Solution Park.
The block diagram example "Total solution process" was created using the ConceptDraw PRO diagramming and vector drawing software extended with the Block Diagrams solution from the area "What is a Diagram" of ConceptDraw Solution Park.
Block diagram
 Health Sciences
Health Sciences solution including professionally designed samples and wide range of high-quality vector icons and pictograms of basic medical sciences, surgery specializations, internal medicine, medical diagnostics, interdisciplinary fields, mental health, obstetrics and gynecology, public health, allied health, and other medical specialties, is a perfect assistant in drawing Health diagrams, schematics, illustrations, infographics and slides for presentations on the healthcare, medical and health sciences thematic, in development knowledge in health science, in studying and representing the physical, mental and social aspects of human health, in determining the role of different health sciences at this process, finding and explaining new methods of treatment different diseases, making an overview and describing the main characteristics of health sciences in a visual form.
 Funnel Diagrams
Funnel Diagrams solution including wide range of funnel diagram samples, sales funnel examples, and vector design elements, makes the ConceptDraw PRO ideal for funnel management and creation the Funnel Diagrams of different types and designs, AIDA Model, AIDAS, ACCA Dagmar, Rossiter-Percy Model, Sales funnel, Marketing funnel, Search funnel, Brand funnel, Purchase funnel, Lead funnel, Conversion funnel, Business funnel, etc. You are free to choose to place your funnel object horizontally or vertically, you can use the objects with desired quantity of sales funnel stages, as well as to modify their size, color filling, and other parameters to make exceptionally looking Funnel diagrams fully responding to your desires.
 Block Diagrams
Block diagrams solution extends ConceptDraw PRO software with templates, samples and libraries of vector stencils for drawing the block diagrams.
 Bubble Diagrams
Bubble diagrams have enjoyed great success in software engineering, architecture, economics, medicine, landscape design, scientific and educational process, for ideas organization during brainstorming, for making business illustrations, presentations, planning, design, and strategy development. They are popular because of their simplicity and their powerful visual communication attributes.
- Block Diagrams | Sample Of Creative Swot Analysis In Psychology
- Concept Maps | Concept Map | Block Diagrams | Educational ...
- Psychology Block Diagrams
- Process Flowchart | Block Diagrams | Concept Maps | Psychology ...
- The Best Choice for Creating Diagram | Concept Mapping ...
- Indratial Psychology Block Diagram
- Block Diagrams | Flowchart Of Function Of Educational Psychology
- Concept Mapping | Concept Maps | Physics Diagrams | Concept ...
- Root cause analysis tree diagram - Personal problem solution ...
- Process Flowchart | Block diagram - Total solution process ...