Map of Continents
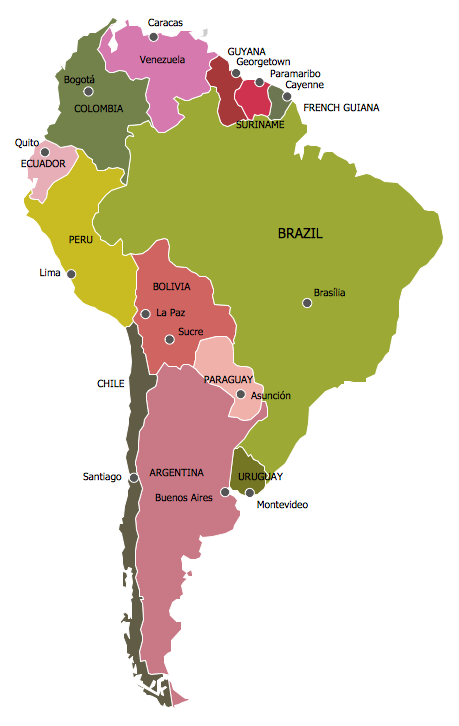
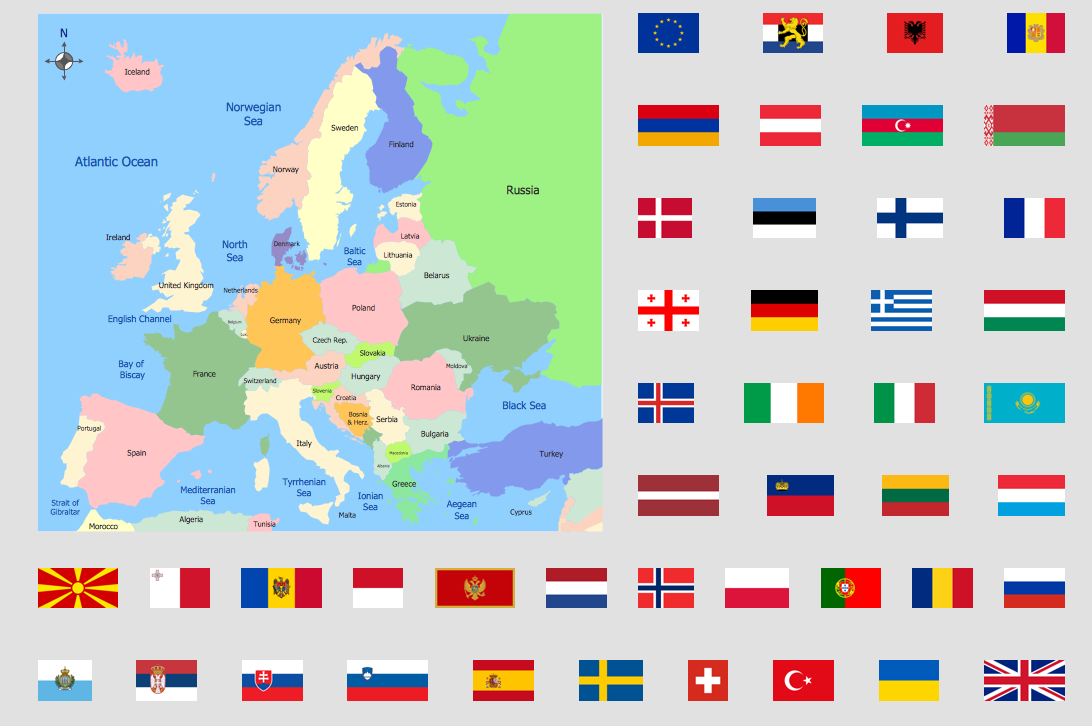
A continent is one of several very large landmasses on Earth. ConceptDraw PRO diagramming and vector drawing software offers the unique Continent Maps Solution from the Maps Area which is indispensable for drawing the map of continents of the Earth.
 Continent Maps
Continent Maps solution extends ConceptDraw PRO software with templates, samples and libraries of vector stencils for drawing the thematic maps of continents, state maps of USA and Australia.
World Continents Map
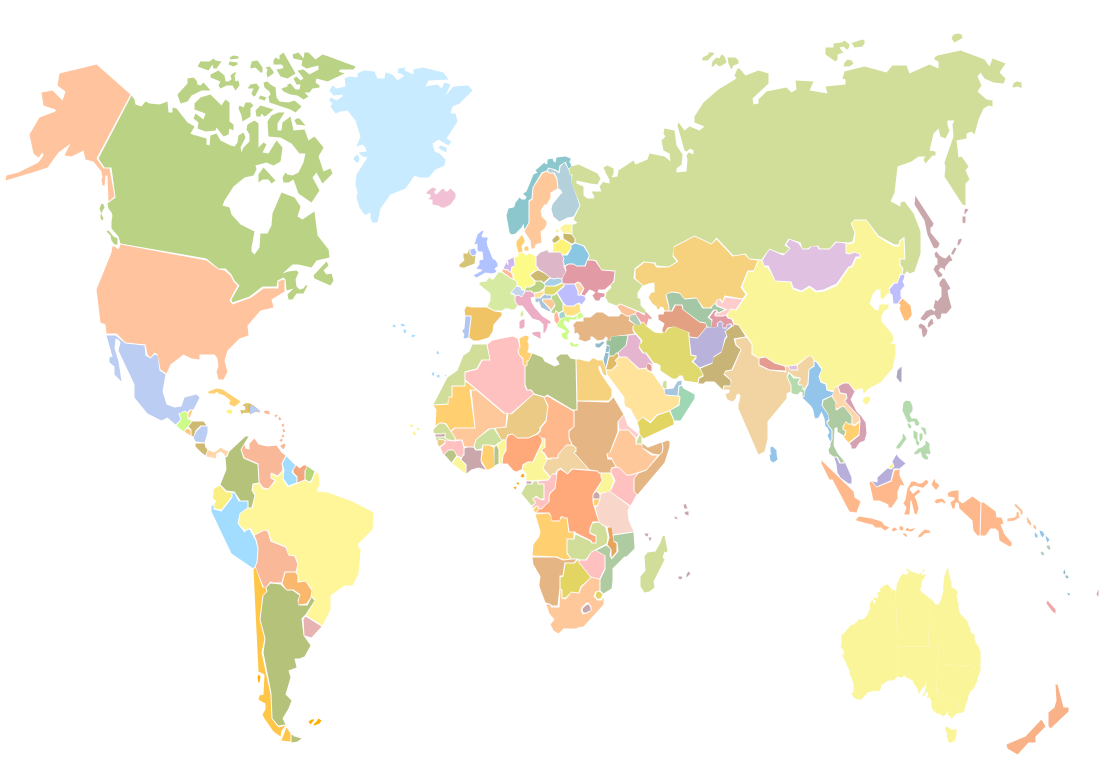
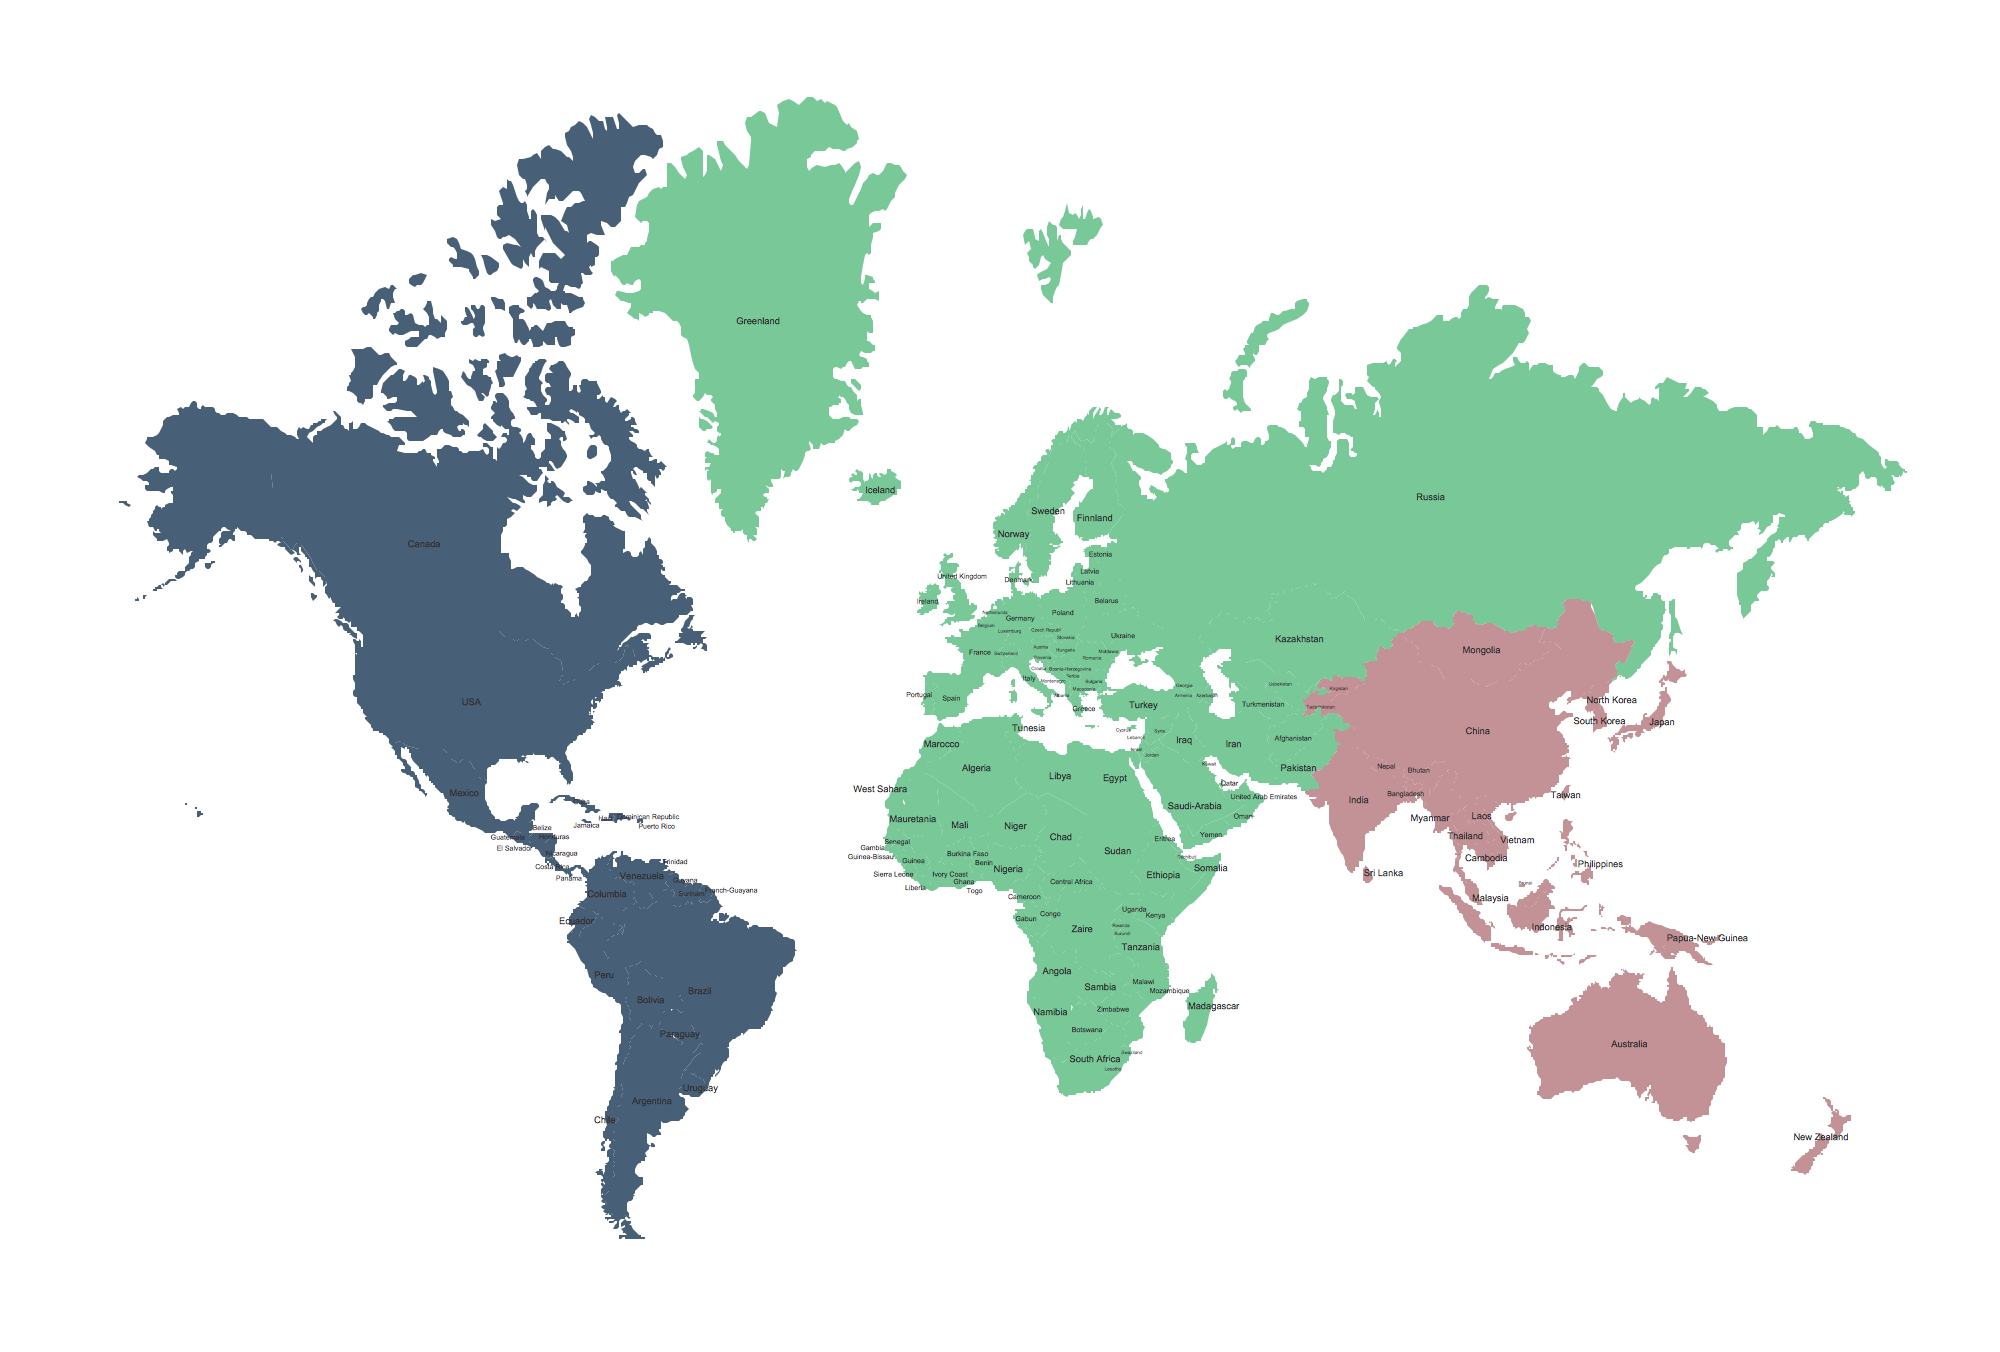
ConceptDraw PRO diagramming and vector drawing software enhanced with Continent Maps Solution from the Maps Area is the best for drawing geographic, topography, political, and many other kinds of maps for any of seven earth continents and also world continents map of any detailing.Geo Map - World
ConceptDraw PRO is idea to draw the geological maps of World from the pre-designed vector geo map shapes.Geo Map Software
Geo Map Software - Full Geographic Reach of Your Business with Geo Map Shapes.
 Seven Basic Tools of Quality
Manage quality control in the workplace, using fishbone diagrams, flowcharts, Pareto charts and histograms, provided by the Seven Basic Tools of Quality solution.
 Seven Management and Planning Tools
Seven Management and Planning Tools solution extends ConceptDraw PRO and ConceptDraw MINDMAP with features, templates, samples and libraries of vector stencils for drawing management mind maps and diagrams.
HelpDesk
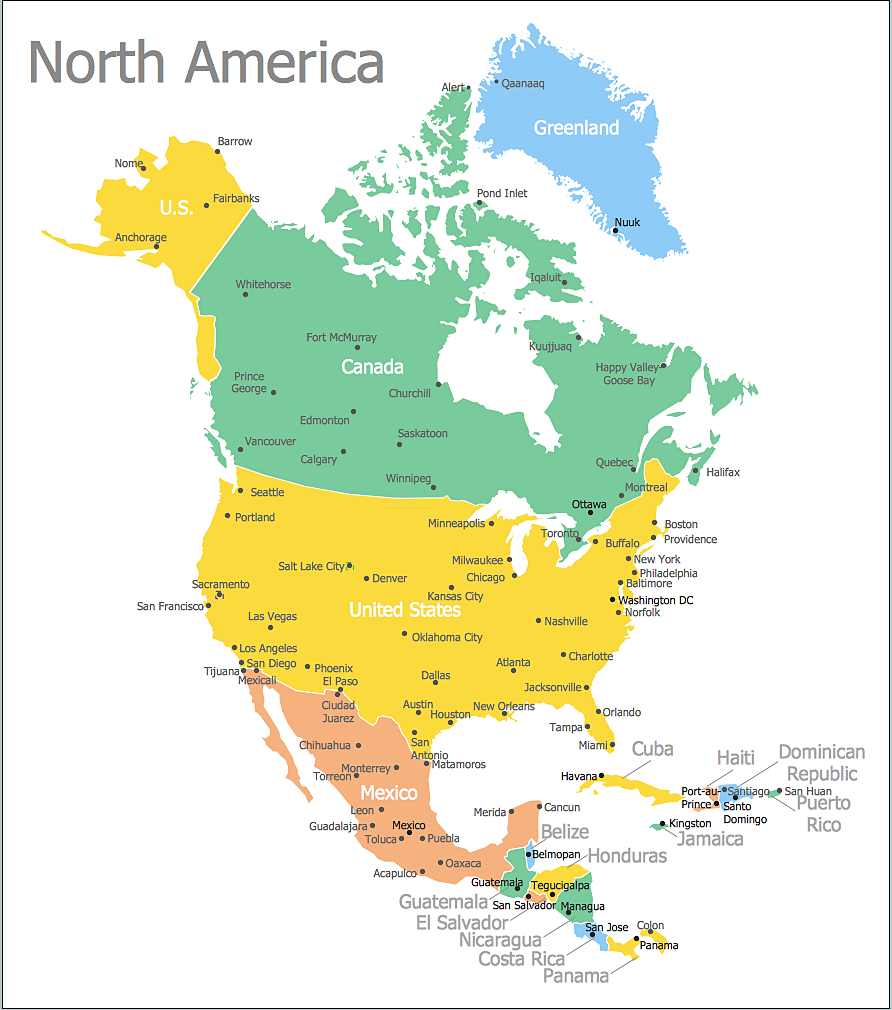
How to Draw a Map of North America Using ConceptDraw PRO
Geographic maps, cardiograms, and thematic maps are often used for geographical visualization of business information. Any country can inspire a wealth of geopolitical statistical data. A common way of assimilating this data is to create maps that convey a particular theme or subject matter in relation to a specific geographical area. Known as thematic maps, they cover themes such as population density, average rainfall, or political allegiance, differentiating the data by using graphical elements and annotation. Thematic maps contrast general reference maps, which tend to display information on a variety of subjects — vegetation, topology, roads and highways, for example. A thematic map will always focus on one particular subject matter. ConceptDraw PRO can be helpful as a tool for creating maps of countries and regions of the world. It allows you to draw continental maps quickly and easily using the special templates and vector stencils libraries.
 Food Court
Use the Food Court solution to create food art. Pictures of food can be designed using libraries of food images, fruit art and pictures of vegetables.
 Fishbone Diagrams
The Fishbone Diagrams solution extends ConceptDraw PRO v10 software with the ability to easily draw the Fishbone Diagrams (Ishikawa Diagrams) to clearly see the cause and effect analysis and also problem solving. The vector graphic diagrams produced using this solution can be used in whitepapers, presentations, datasheets, posters, and published technical material.
 Pyramid Diagrams
Pyramid Diagrams solution extends ConceptDraw PRO software with templates, samples and library of vector stencils for drawing the marketing pyramid diagrams.
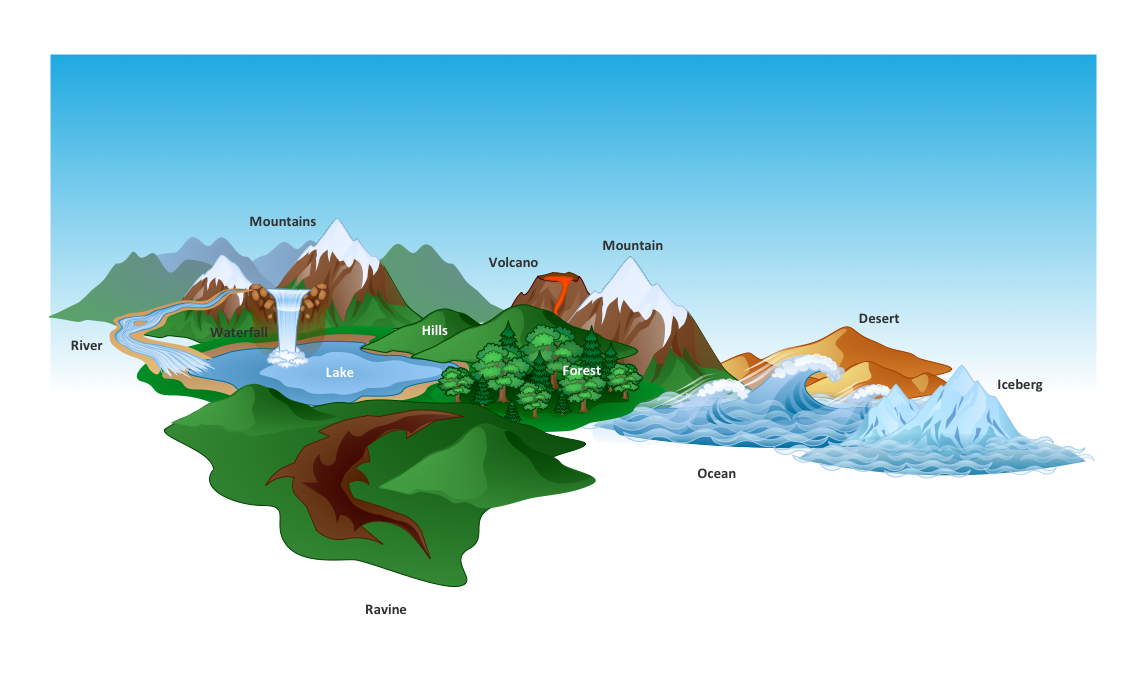
Beautiful Nature Scene: Drawing
The Nature Solution addition to ConceptDraw Solution Park for ConceptDraw PRO includes new libraries that provide a wide range nature objects and it can be used to augment documentation and graphics. Draw beautiful nature scenes using ConceptDraw PRO software with Nature solution.Amazon Cloud Computing Architecture
The ConceptDraw PRO diagramming and vector drawing software provides the Cloud Computing Diagrams solution from the Computers and Network area of ConceptDraw Solution Park with powerful drawing tools and libraries containing large amount of predesigned vector objects for easy designing and displaying the structure of Amazon Cloud Computing Architecture.
 ConceptDraw Solution Park
ConceptDraw Solution Park collects graphic extensions, examples and learning materials
3 Circle Venn. Venn Diagram Example
This example shows the 3 Circle Venn Diagram. The Venn Diagrams visualize all possible logical intersections between several sets. On this example you can see the intersections of 3 sets. Venn Diagrams are widely used in mathematics, logic, statistics, marketing, sociology, etc.- 7 Continents Diagram
- Seven Continents And The Diagram
- Seven Continent Diagram
- Diagram Of The Seven Continents And Their Countries
- Bar Graphs | Continent Maps | Seven Basic Tools of Quality | Bar ...
- 7 Continents Map | Map of Continents | World Continents Map ...
- 7 Continents Map | Map of Continents | Continent Maps | Diagram Of ...
- The Seven Continents Of The World With Their Diagram
- A Bar Graph Representing Area Of 7 Continents
- 7 Continents Map | Continent Maps | Map of Continents | Diagram Of ...
- World Continents Diagram
- Pie Graph Of 7 Continents
- Seven Contients Imformation And Diagram
- Draw And All Seven Continent
- Draw Seven Continents
- Show The Diagram Of The Seven Contenents
- World Continents Map | Map of Continents | Continent Maps | Seven ...
- The Diagram Of A Continent
- How To Draw The Seven Continents
- 7 Continents Map | World Continents Map | Map of Continents ...
