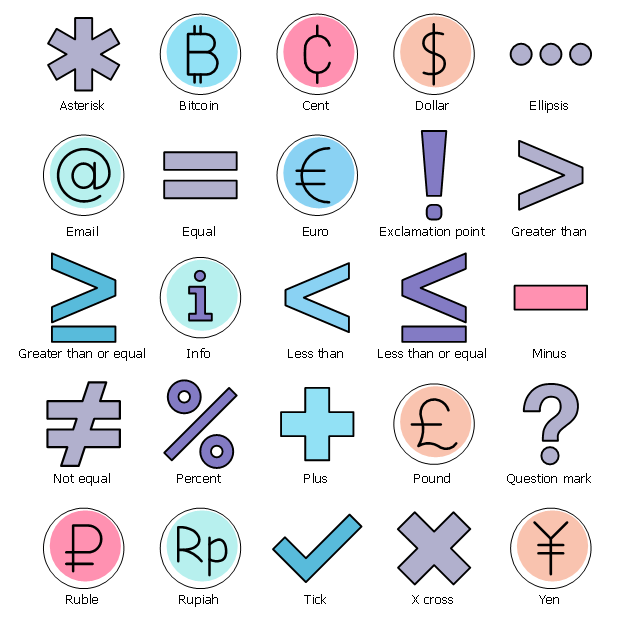
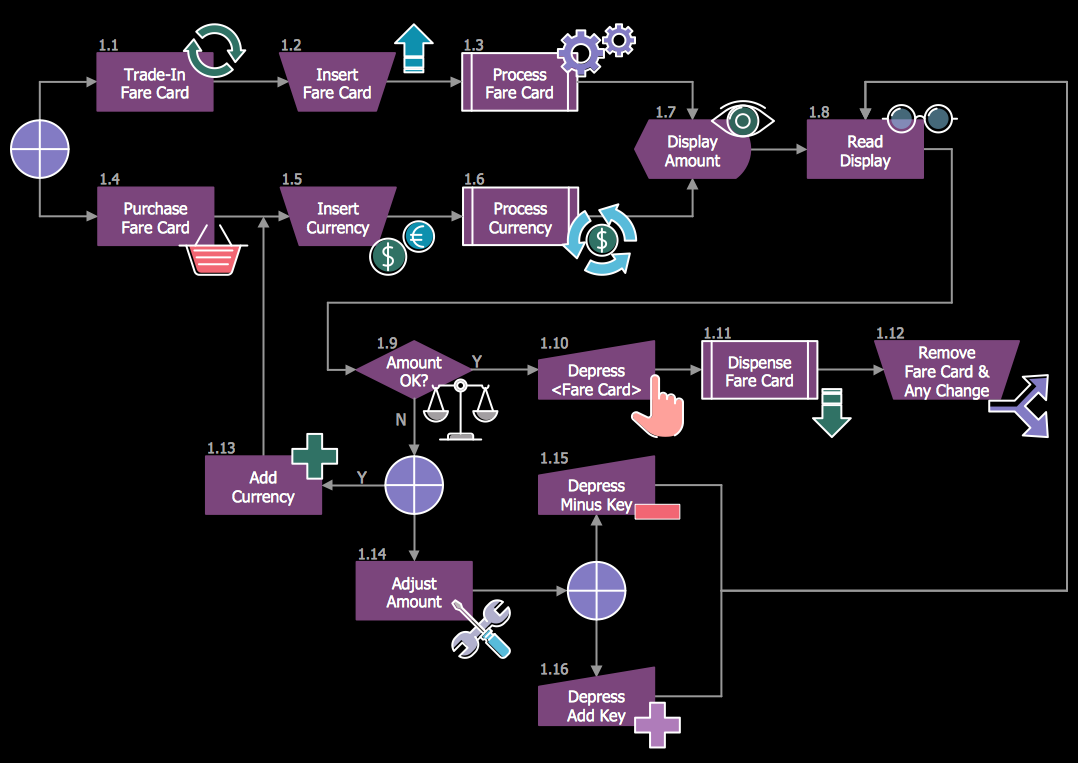
The vector stencil library "Decision signs" contains 25 mathematical symbols, currency signs and punctuation marks.
Use it to design your decision diagrams, flow charts and infographics.
The symbols example "Design elements - Decision signs" is included in Decision Making solution from Management area of ConceptDraw Solution Park.
Use it to design your decision diagrams, flow charts and infographics.
The symbols example "Design elements - Decision signs" is included in Decision Making solution from Management area of ConceptDraw Solution Park.
Basic Flowchart Symbols and Meaning
Flowcharts are the best for visually representation the business processes and the flow of a custom-order process through various departments within an organization. ConceptDraw DIAGRAM diagramming and vector drawing software extended with Flowcharts solution offers the full set of predesigned basic flowchart symbols which are gathered at two libraries: Flowchart and Flowcharts Rapid Draw. Among them are: process, terminator, decision, data, document, display, manual loop, and many other specific symbols. The meaning for each symbol offered by ConceptDraw gives the presentation about their proposed use in professional Flowcharts for business and technical processes, software algorithms, well-developed structures of web sites, Workflow diagrams, Process flow diagram and correlation in developing on-line instructional projects or business process system. Use of ready flow chart symbols in diagrams is incredibly useful - you need simply drag desired from the libraries to your document and arrange them in required order. There are a few serious alternatives to Visio for Mac, one of them is ConceptDraw DIAGRAM. It is one of the main contender with the most similar features and capabilities.
HelpDesk
How to Draw a Decision-Making Diagram
The Decision-Making solution provides ConceptDraw DIAGRAM users with vector libraries, containing a full set of flowchart symbols. Also, it offers a number of templates and samples, making short work of creating a graphical view of decision-making processes.
 Decision Making
The Decision Making solution offers the set of professionally developed examples, powerful drawing tools and a wide range of libraries with specific ready-made vector decision icons, decision pictograms, decision flowchart elements, decision tree icons, decision signs arrows, and callouts, allowing the decision maker (even without drawing and design skills) to easily construct Decision diagrams, Business decision maps, Decision flowcharts, Decision trees, Decision matrix, T Chart, Influence diagrams, which are powerful in questions of decision making, holding decision tree analysis and Analytic Hierarchy Process (AHP), visual decomposition the decision problem into hierarchy of easily comprehensible sub-problems and solving them without any efforts.
Workflow Diagram
Workflow diagram is a perfect tool to represent visually a repeatable pattern of organizational activity that is powered by resources and to describe in details the transferring of data, documents or tasks during a work process. It effectively explains and documents the process flow that exists and that requires the studying, analyzing and execution. Workflow diagrams help to represent the working processes in a simple visual manner, to follow easy the path of a task in a workflow, to identify the persons responsible for the execution of each stage, to show the accompanied documents and needed resources. All this helps to optimize the workflow and to discover its weak points. Workflow diagrams are mainly designed and used as a part of project documentation, certification process and company policies to comply the standards. To design professionally the Workflow diagrams, use the ConceptDraw DIAGRAM software. Enhanced with Workflow Diagrams solution from the Business Processes area, the ConceptDraw DIAGRAM it is a powerful workflow diagram maker.Sales Process Flowchart Symbols
The most easier way of creating the visually engaging and informative Sales Process Flowchart is to create the new ConceptDraw document and to use the predesigned vector symbols offered in 6 libraries of the Sales Flowchart Solution. There are more than six types of sales process flow diagrams, ConceptDraw DIAGRAM software is flowchart maker which include six collections of extended flowchart symbols for effective diagramming. There are main collections of color coded flowchart symbols: Sales Department, Sales Steps, Sales Workflow, Sales Symbols and special set of Sales Arrows and Sales Flowchart.HelpDesk
How to Create Flowchart Using Standard Flowchart Symbols
Flowcharts are used to display an algorithm for consistent execution of certain steps. Flowchart is probably the easiest way to make a graphical representation of any process. Flowcharts use the set of standard geometric symbols and arrows to define relationships. ConceptDraw DIAGRAM allows you to create professional flowchart quickly and easily. The ability to create flowcharts is contained in the Flowcharts solution. The solution provides a set of special tools for creating flowcharts.Flowchart design. Flowchart symbols, shapes, stencils and icons
A flowchart is a type of diagram which represents an algorithm, process or workflow, displays the steps as boxes of various kinds and depicts their order by connecting them with arrows. Any business graphic document will be more colorful and understandable if will use professional-looking and visual diagrams and flowcharts. Flowchart design gives versatile presenting and explaining of the process. ConceptDraw DIAGRAM flowchart software enhanced with Flowcharts solution helps effectively make Flowchart Design. Use of predesigned flowchart symbols and bright color palette offers a fresh view and favorably distinguishes the flowcharts designed in ConceptDraw DIAGRAM from the black and white flowcharts on a paper. Preferably to use no more than three or four colors and apply identical for the same shape types. The best flowchart design can be achieved by starting with Flowchart template, or any of suitable ready examples or samples offered in ConceptDraw STORE, open one of them and enter the proper text into each Flowchart shape. Each symbol of the flowchart has a definition that can't be changed. This means that all flowcharts shapes can be grouped in according to their meaning. Users with ConceptDraw DIAGRAM flowchart software can style groups of symbols with close definitions by color sets chosen from complementary palette. Almost all workflows can be depicted as a flowchart. Colored diagrams are more light for perception of the certain information, this is part of flowchart design. Bright colors need to be used in the key points of Decision symbols, to focus attention on their importance for whole process flow.
How To Make the Right Decision in Projects
A key point of conference success is the ability to see slides in real time, and hold documented discussions during the meeting. Remote Presentation for Skype is a new solution allows real-time presenting that benefits work groups who need collaborate by web meetings.
Business Process Flowchart Symbols
Business process modeling is known in the corporate world as an excellent tool which can speak. Business process flowcharts, diagrams and maps are used to define the business processes in terms of inputs and outputs, to visually represent and effectively explain complex business processes of an enterprise, and also showcase decisions on a single piece of paper. The process of business process mapping supposes the use of special business process flowchart symbols predefined by Business Process Modeling Notation (BPMN) and taking their roots from the data processing diagrams and programming flow charts. In other words the BPMN standard notation is a common language used for business process design and implementation, that guarantees a clarity of designed Business Process Flowcharts for all business analysts, technical developers and business managers. The ability to create professionally-looking Business Process flowcharts, maps and diagrams, is provided by powerful ConceptDraw DIAGRAM software and the Business Process Mapping solution included to ConceptDraw Solution Park.- Decision Symbol In Block Diagram
- Multiple Decision Point Flow Chart
- Design elements - Flowchart | Processing Box Used In Flowchart
- Output Sign In Flowchart
- Visio Symbol For Multi Decision Chart
- Symbol For For Loop In Flow Chart
- Basic Flowchart Symbols and Meaning | Audit Flowchart Symbols ...
- Process decision program chart (PDPC) - Personal activity | Process ...
- Solution for Effective Decision Making
- Comment In Flow Chart Is Represented By Which Symbol


