Bubble diagrams in Landscape Design with ConceptDraw DIAGRAM
Bubble Diagrams are the charts with a bubble presentation of data with obligatory consideration of bubble's sizes. They are analogs of Mind Maps and find their application at many fields, and even in landscape design. At this case the bubbles are applied to illustrate the arrangement of different areas of future landscape design, such as lawns, flowerbeds, playgrounds, pools, recreation areas, etc. Bubble Diagram helps to see instantly the whole project, it is easy for design and quite informative, in most cases it reflects all needed information. Often Bubble Diagram is used as a draft for the future landscape project, on the first stage of its design, and in case of approval of chosen design concept is created advanced detailed landscape plan with specification of plants and used materials. Creation of Bubble Diagrams for landscape in ConceptDraw DIAGRAM software is an easy task thanks to the Bubble Diagrams solution from "Diagrams" area. You can use the ready scanned location plan as the base or create it easy using the special ConceptDraw libraries and templates.HelpDesk
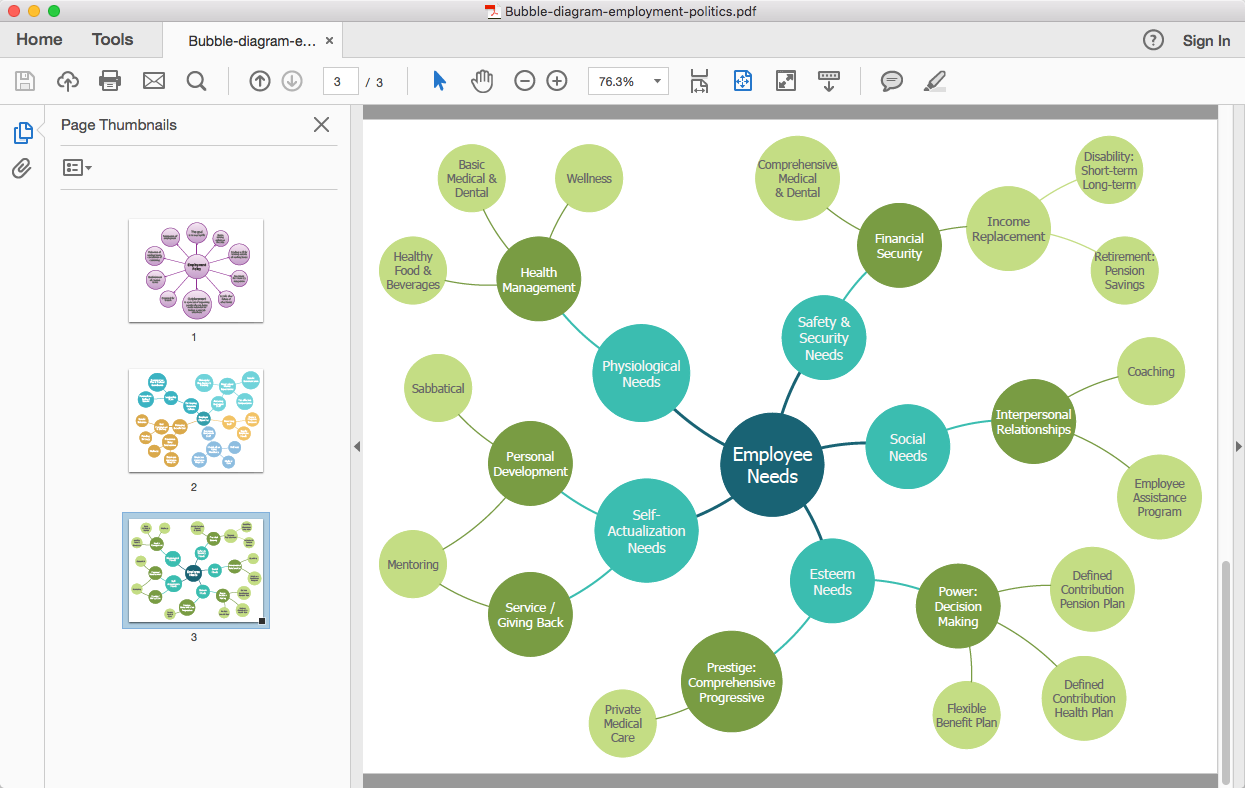
How To Convert a Bubble Diagram to Adobe PDF
ConceptDraw DIAGRAM allows you to easy share your business documentation between different computers with different operating systems and applications using it's export capabilities. You can get your bubble diagrams in pdf format and freely communicate them with others.HelpDesk
How to Add a Bubble Diagram to PowerPoint Presentation
Bubble diagrams can be used to compare concepts, and identify areas of similarity and difference. ConceptDraw DIAGRAM allows you to make a MS PowerPoint Presentation from your charts in a few simple steps.HelpDesk
How to Create a Timeline Diagram
A Timeline is a chart which displays a project plan schedule in chronological order. A Timeline is used in project management to depict project milestones and visualize project phases and show project progress. The graphic form of a timeline makes it easy to understand critical project milestones, such as the progress of a project schedule. Timelines are particularly useful for project scheduling or project management when accompanied with a Gantt chart. It captures the main of what the project will accomplish and how it will be done. making a project timeline is one of the most important skills a project manager needs have. Making comprehensive, accurate timelines allows you getting every project off in the best way. ConceptDraw DIAGRAM allows you to draw a timeline chart using a special library.- Difference Between Flowchart And Bubble Diagram
- Difference Between Flow Chart And Bubble Diagram
- Bubble Flow Chart
- Bubble diagrams in Landscape Design with ConceptDraw PRO ...
- Bubble Diagram And Functional Flowchart
- Difference Between Gantt Chart And Process Flow Chart
- Bubble diagrams with ConceptDraw PRO | Process Flowchart | Data ...
- What Are The Differences Between Bubble Diagram And Flow Chart
- Diff BW Bubble Diagram And Flow Chart
- Difference Between Flow Chart And Vector Diagram
- The Use Of Bubble Diagrams In Making A Flow Chart
- Basic Flowchart Symbols and Meaning | How To Make a Bubble ...
- Difference Between System And Program Flow Chart
- Differentiate Between Bubble Diagram And Flow Chart
- Different Between A Flowchart And A Bubble Diagram
- Difference Between A Flow Chat And A Bubble Diagram
- Diffrent Between Flow Chart And Bubble Chart
- Bubble Chart | Technical Flow Chart Example | How To Create a ...
- Functional Relationship Design Bubble Diagram
- Difference Between System Flowchart To Program Flowchart


