HelpDesk
How to Create a Gantt Chart for Your Project
Instruction on how to create Gantt chart using ConceptDraw PROJECT software. Gant Chart is a graphical representation of tasks as segments on a time scale. It helps plan or overlapping.HelpDesk
How to Draw a Gantt Chart Using ConceptDraw PRO
A Gantt chart is intended to provide a visualization of a project schedule. It is developed to help planning, coordinating, and tracking on project tasks implementation. One of the most critical resources for a project implementation is a time resources. Gantt chart - is one of the most convenient and popular way of graphical representation of a project tasks progress in conjunction with the corresponding time consumption. Gantt chart's function is to show project tasks completion in a progress, and to make a project manager sure that project tasks were completed on time. ConceptDraw Office is a clear and easy-to-use tool for project management. It is a very handy visual tool that helps make a project processing clear.HelpDesk
How to Track Your Project Plan vs. the Actual Project Condition
Conceptdraw PROJECT provides user with the possibility to track how the project is going. Project Manager can compare the actual data with the planned and assess possible measures to resolve issues. Conceptdraw PROJECT has several types of visual reports that can help to assess visually the difference between planned and actual project data.HelpDesk
How to Make a Mind Map from a Project Gantt Chart
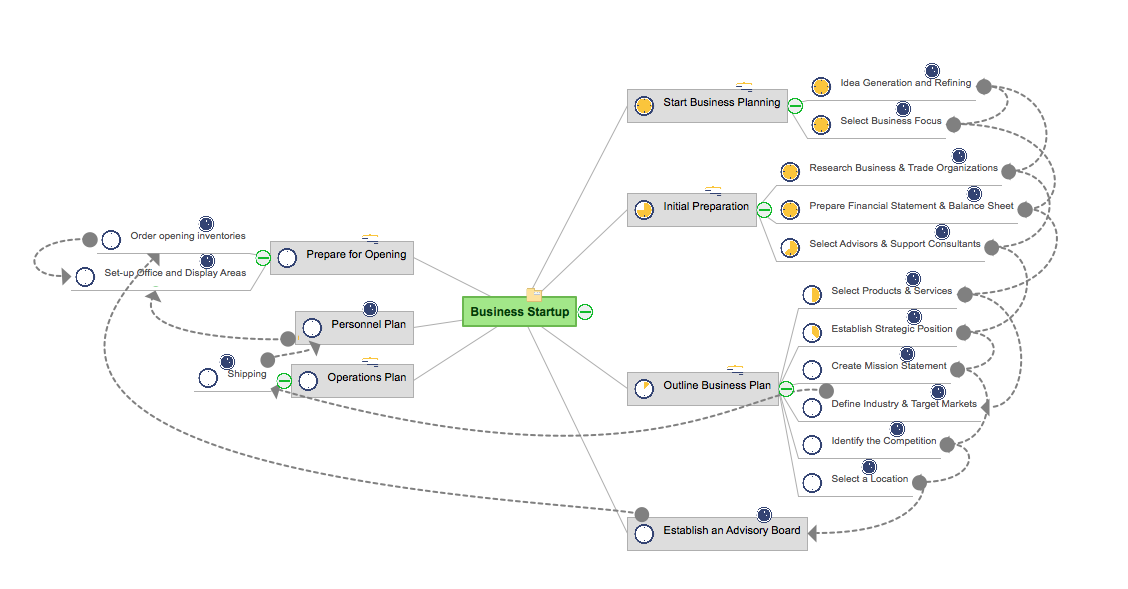
ConceptDraw Office allows you to see the project data from ConceptDraw PROJECT in a mind map structure by opening your project in ConceptDraw MINDMAP.HelpDesk
What Information to be Displayed in the ConceptDraw PROJECT Gantt Chart View
What information can can contain the project task list? Gantt Chart view is a graphical representation of a project outline that allows one to allocate tasks.You can customize a project’s tasks list view to include the columns you need to meet your information requirements. The columns of the ConceptDraw PROJECT Gantt view contain the information you want to capture about each task in your project. The following article details what information can be contained in the columns of a project outline:<
 Business Processes
Business Process solution extends ConceptDraw PRO software with business process diagrams as cross-functional flowcharts, workflows, process charts, IDEF0, timelines, calendars, Gantt charts, business process modeling, audit and opportunity flowcharts.
Project —Task Trees and Dependencies
Users new to ConceptDraw PROJECT will find the Basic lessons an essential platform for familiarizing themselves with the program′s functions. This video lesson will teach you how to set up task trees and dependencies.- Difference Between Timeline And Gantt Chart
- Difference Between Gantt Chart And Process Flow Chart
- Difference Between Pert And Gantt Chart
- Difference Between A Timeline And A Gantt Chart
- Difference Between Gantt Chart And Critical Path Analysis
- The Difference Between A Timeline And A Grantt Chart
- Difference Between Gantt Chart And Pert Chart
- Difference Between Gantt Chart And Pert Chart In Software ...
- Difference Between Flowchart And Bubble Diagram
- The Difference Between Project And Process
- Different Between Algorithm And Flow Chart Essily
- Difference Between Workflow Diagram And Flowchart
- Difference Between A Flow Chat And A Bubble Diagram
- Difference Between Flow Chart And Vector Diagram
- Open Source Gantt Chart Software
- Diff Between Pert Chart And Gantt Chart
- Difference Between Flow Chart And Pie Chart
- Difference Between Flow Process Chart And Operation Process
- Difference Between Algorithm And Flow Cahr
- Difference Between Operation Process Chart And Flow Process Chart


