Bus Network Topology
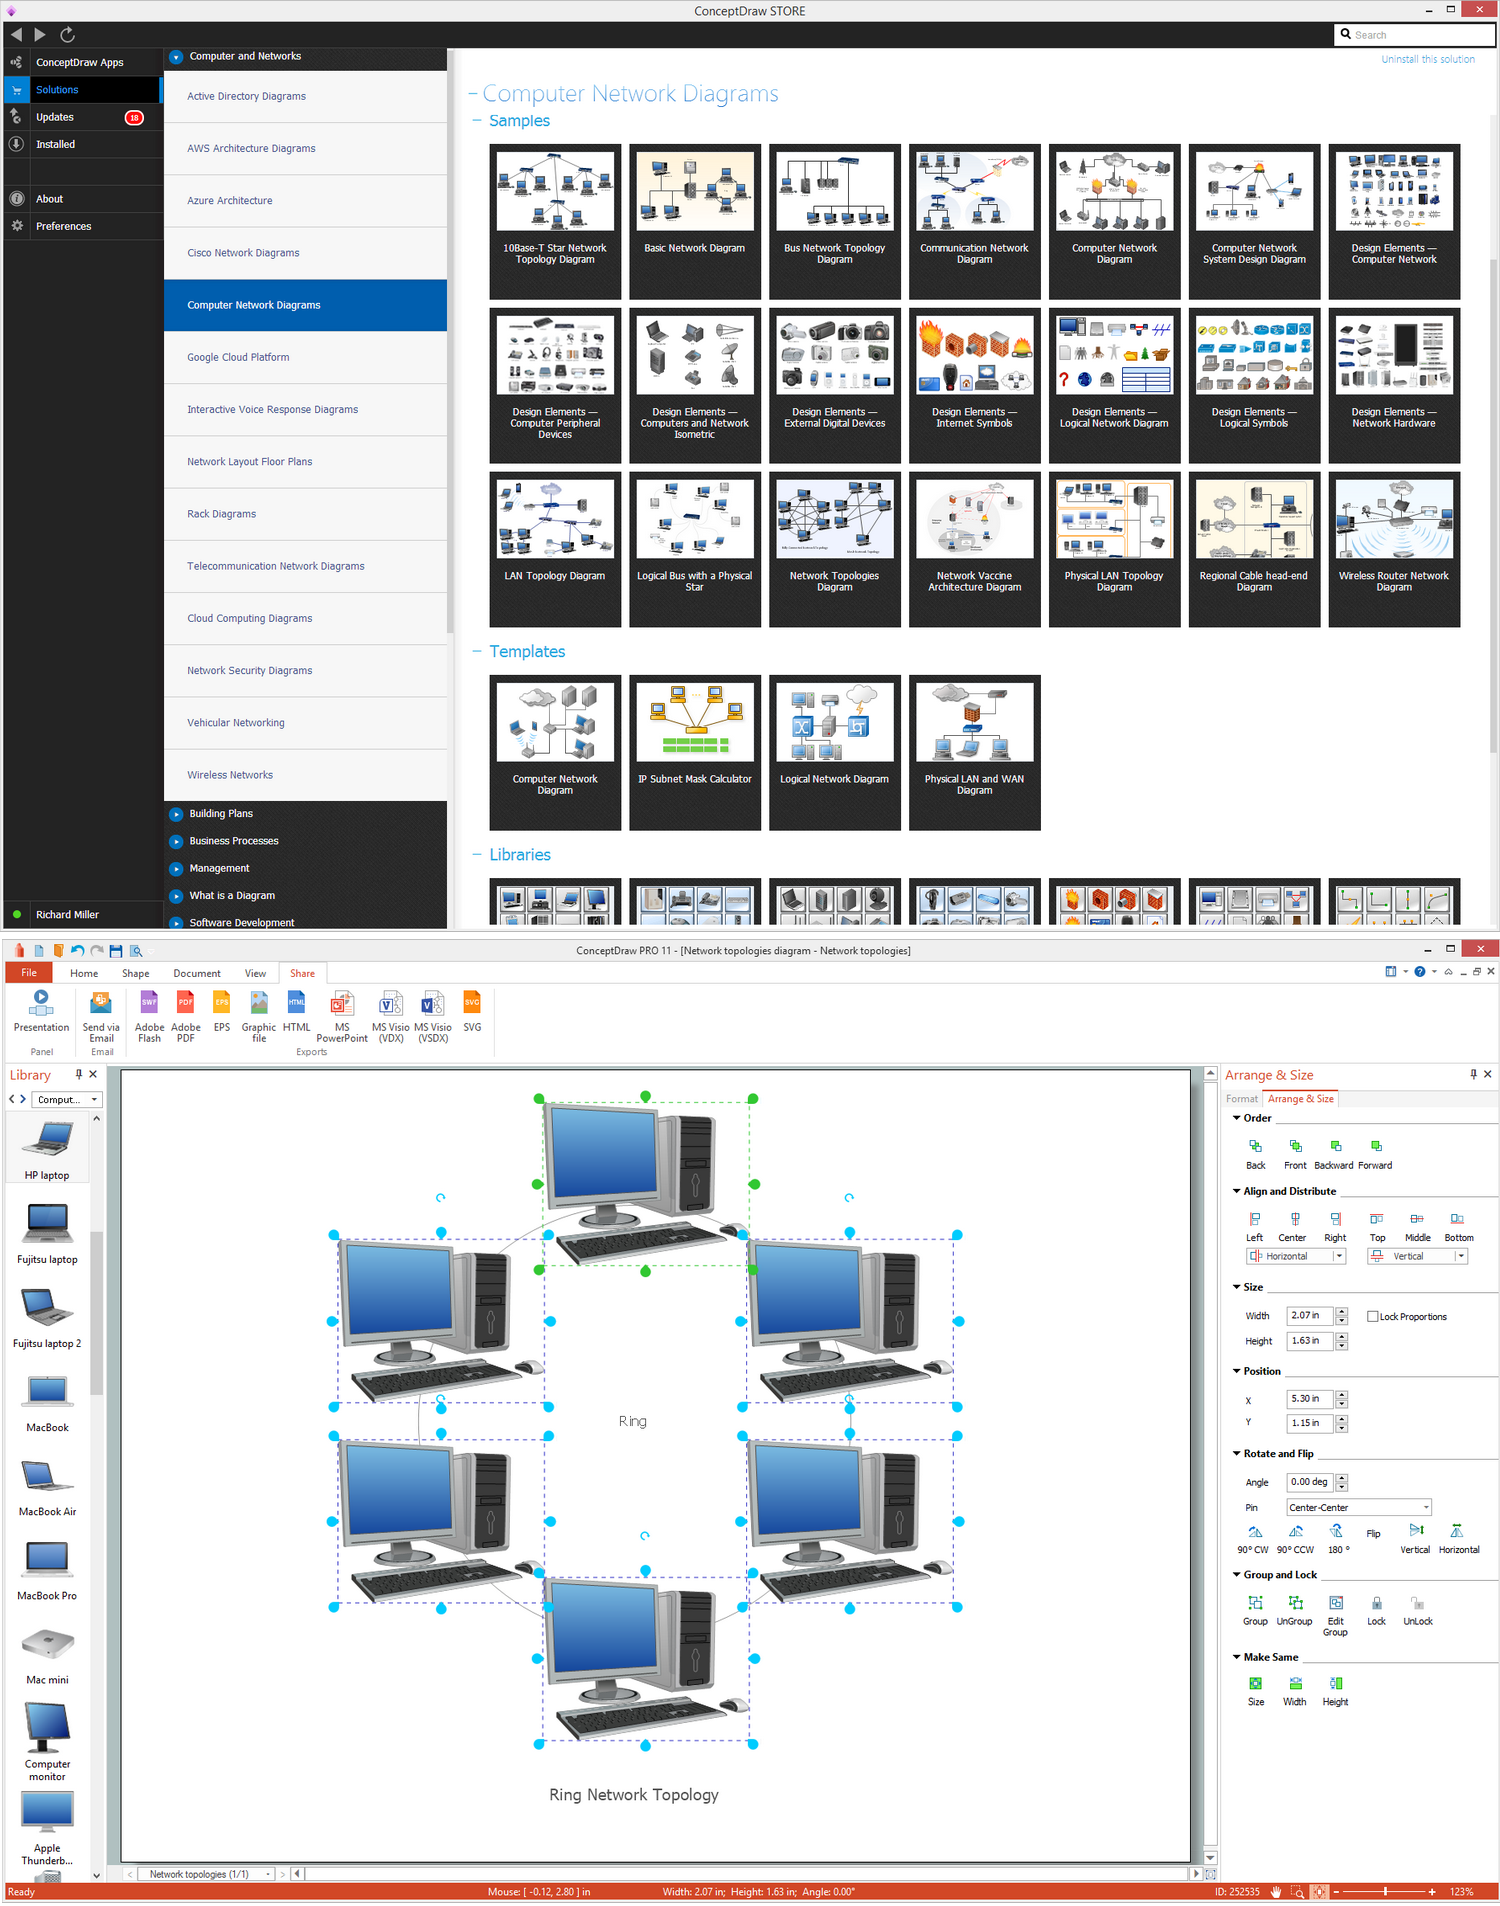
Bus Network Topology is a network topology that represents one shared cable (called a bus or backbone) to which are directly connected all workstations or computers of the network. At the ends of the cable are situated the terminators for prevention the signal reflection. All workstations at Bus Network Topology have equal rights and transfer the information sequentially, one after another. The message sent by one of workstations is extended on all computers of the network and each computer checks to whom it is addressed, if for him, then processes it. Addition of new subscribers to the "bus" is quite simple, the failures of individual computers are not dangerous, and the lack of a central subscriber even more increases its reliability. Computer and Networks solution included to Computer and Networks area of ConceptDraw Solution Park offers templates, samples and numerous vector stencils libraries that can be used to effectively design different physical and logical network topologies diagrams for wireless and wired computer networks, including Bus Network Topology.Ring Network Topology
The Ring Network Topology Diagram examples was created using ConceptDraw DIAGRAM software with Computer and Networks solution.Network Topologies
Network topology is a topological structure of computer network, which can be physical or logical. The physical topology depicts location of different computer network elements such as computers, cables and other devices. The logical topology visually displays network dataflows from one device to another. Sometimes network logical and physical topologies can be the same. ConceptDraw DIAGRAM diagramming and vector drawing software is powerful for drawing network maps and network topologies diagrams of any kinds and complexity thanks to the Computer Network Diagrams solution from the Computer and Networks area. ConceptDraw STORE proposes collection of network icons libraries and a lot of Network Topology Diagram examples, samples and templates which were created at ConceptDraw DIAGRAM software specially for Computer Network Diagrams solution. There are six basic types of the network topologies: Bus, Star, Ring, Mesh, Tree, Fully Connected. You can fast and easy design professional-looking diagram for each of them using the ConceptDraw DIAGRAM tools. There are plenty of web Visio-like diagramming software available. Web based diagrams software can be powerful, but sometimes it is essential to have desktop software. One of the most advanced diagrams tools like Visio for Mac OS is ConceptDraw DIAGRAM app.
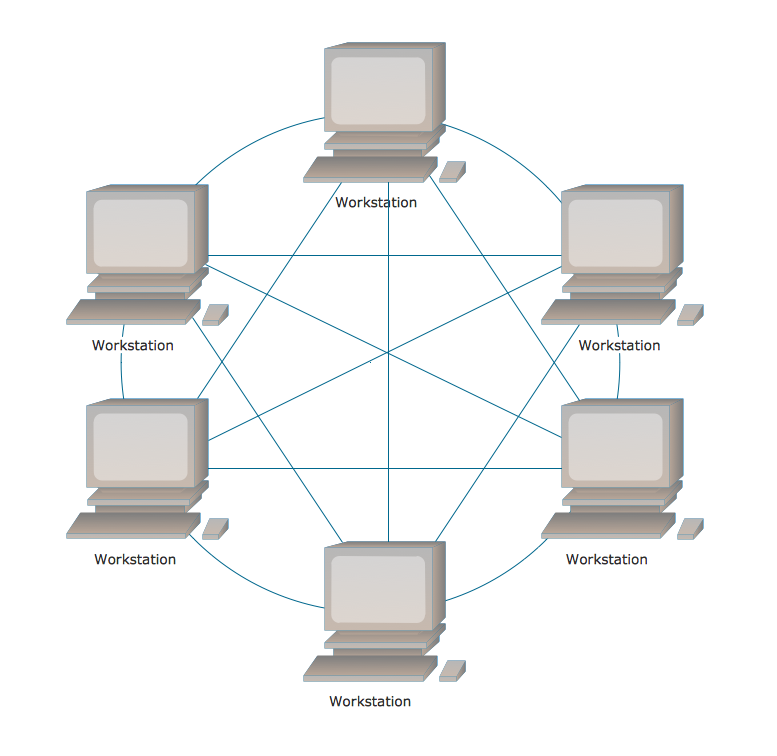
Fully Connected Network Topology Diagram
Fully Connected Network Topology (Complete topology, Full mesh topology) is a network topology characterized by existence of direct links between all pairs of nodes. The Fully connected network including n nodes, contains n(n-1)/2 direct links. This topology is mostly used in military applications. It is a quite expensive network technology and is extremely impractical for the large networks. But when it is set, it provides a high degree of reliability thanks to the large quantity of redundant links between nodes and so multiplicity of paths for the data. The two-node network is also considered as a Fully connected network. Computer Network Diagrams solution from Computer and Networks area of ConceptDraw Solution Park offers the predesigned vector stencils libraries, examples and templates for easy designing various Computer network topology diagrams for wired and wireless networks, including the Fully connected topology. This solution is intended to help computer network designers and engineers perfectly illustrate network documentation, reports, presentations, etc.ERD Symbols and Meanings
Entity Relationship Diagram (ERD) is a popular software engineering tool for database modeling and illustration the logical structure of databases, which uses one of two notations - Chen's or Crow’s Foot. Crow's foot notation is effective when used in software engineering, information engineering, structured systems analysis and design. Each of these notations applies its own set of ERD symbols. Crow's foot diagrams use boxes to represent entities and lines between these boxes to show relationships. Varied shapes at the ends of lines depict the cardinality of a given relationship. Chen's ERD notation is more detailed way to represent entities and relationships. ConceptDraw DIAGRAM application enhanced with all-inclusive Entity-Relationship Diagram (ERD) solution allows design professional ER diagrams with Chen's or Crow’s Foot notation on your choice. It contains the full set of ready-to-use standardized ERD symbols and meanings helpful for quickly drawing, collection of predesigned ERD samples, examples and templates. ConceptDraw Pro is a great alternative to Visio for Mac users as it offers more features and can easily handle the most demanding professional needs.
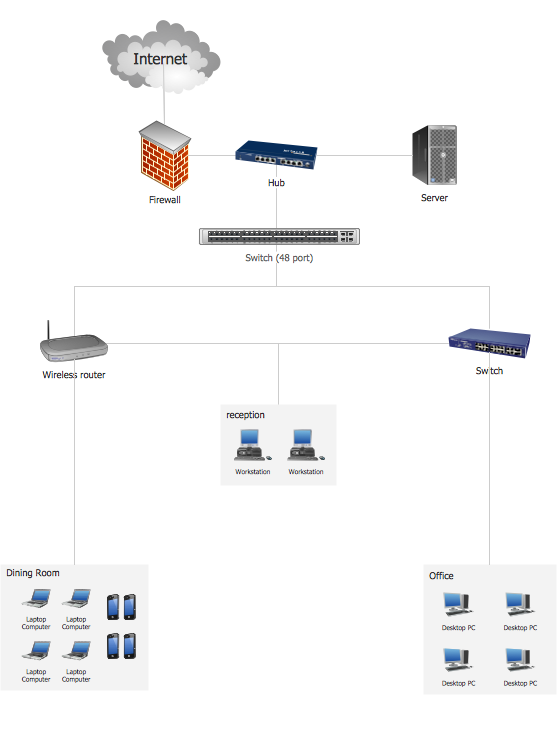
Hotel Network Topology
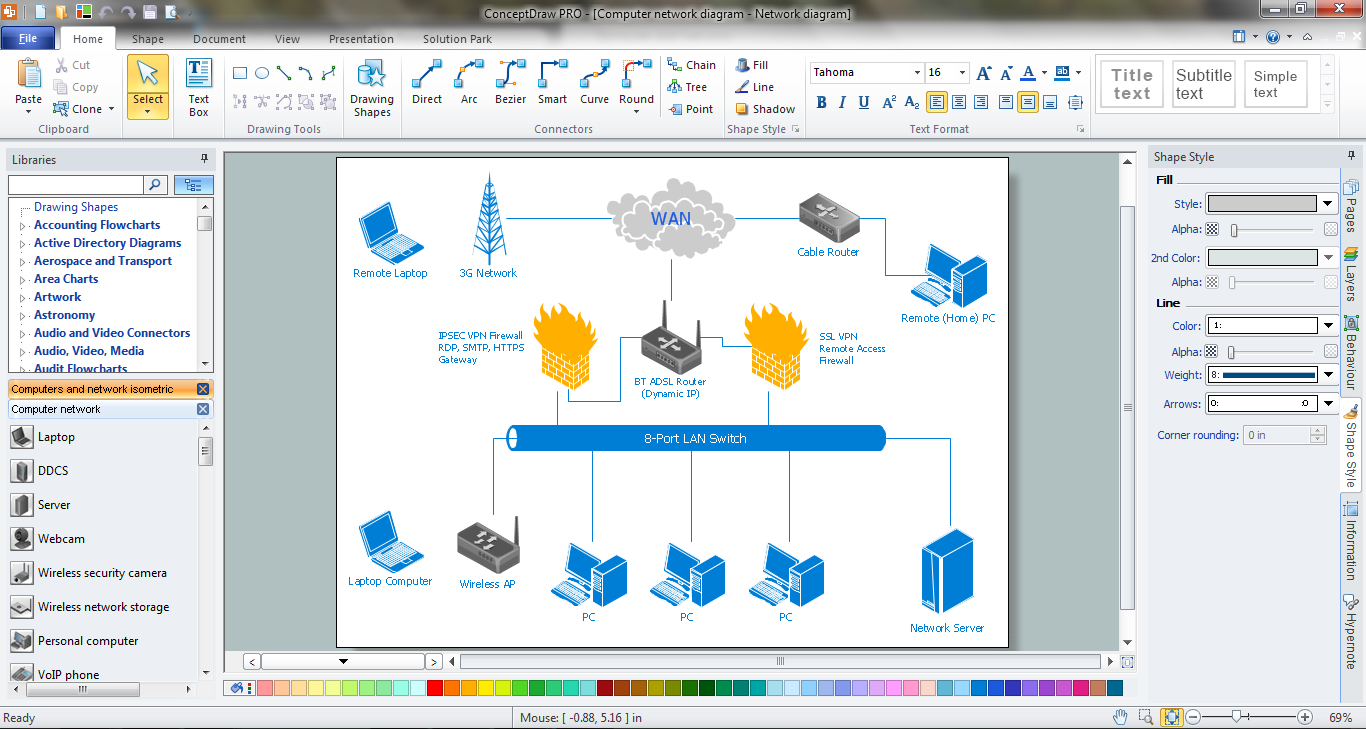
Using the predesigned objects, templates and samples of the Computer and Networks Solution for ConceptDraw DIAGRAM you can create your own professional Computer Network Diagrams quick and easy.Network Glossary Definition
The network glossary contains a complete list of network, computer-related and technical terms in alphabetic order, explanations and definitions for them, among them there are words well known for you and also specific, rare-used, uncommon or newly introduced terms. This specialized glossary, also known as a vocabulary, is the best in its field and covers in details the various aspects of computer network technologies. This glossary was developed by specialists using the practical experience and many useful sources to help the ConceptDraw users in their work, you can read and learn it from the screen on-line or print, it can be also used as a perfect educational guide or tutorial. ConceptDraw DIAGRAM software extended with Computer and Networks solution is easy to draw various types of Network diagrams, Network topology diagrams, Computer networking schematics, Network maps, Cisco network topology, Computer network architecture, Wireless networks, Vehicular networks, Rack diagrams, Logical, Physical, Cable networks, etc. Desktop ConceptDraw DIAGRAM Software is a good Visio for Mac Os X replacement. It gives you rich productivity and quality of the produced diagrams.
Network Diagramming Software for Design. Cisco Network Diagrams
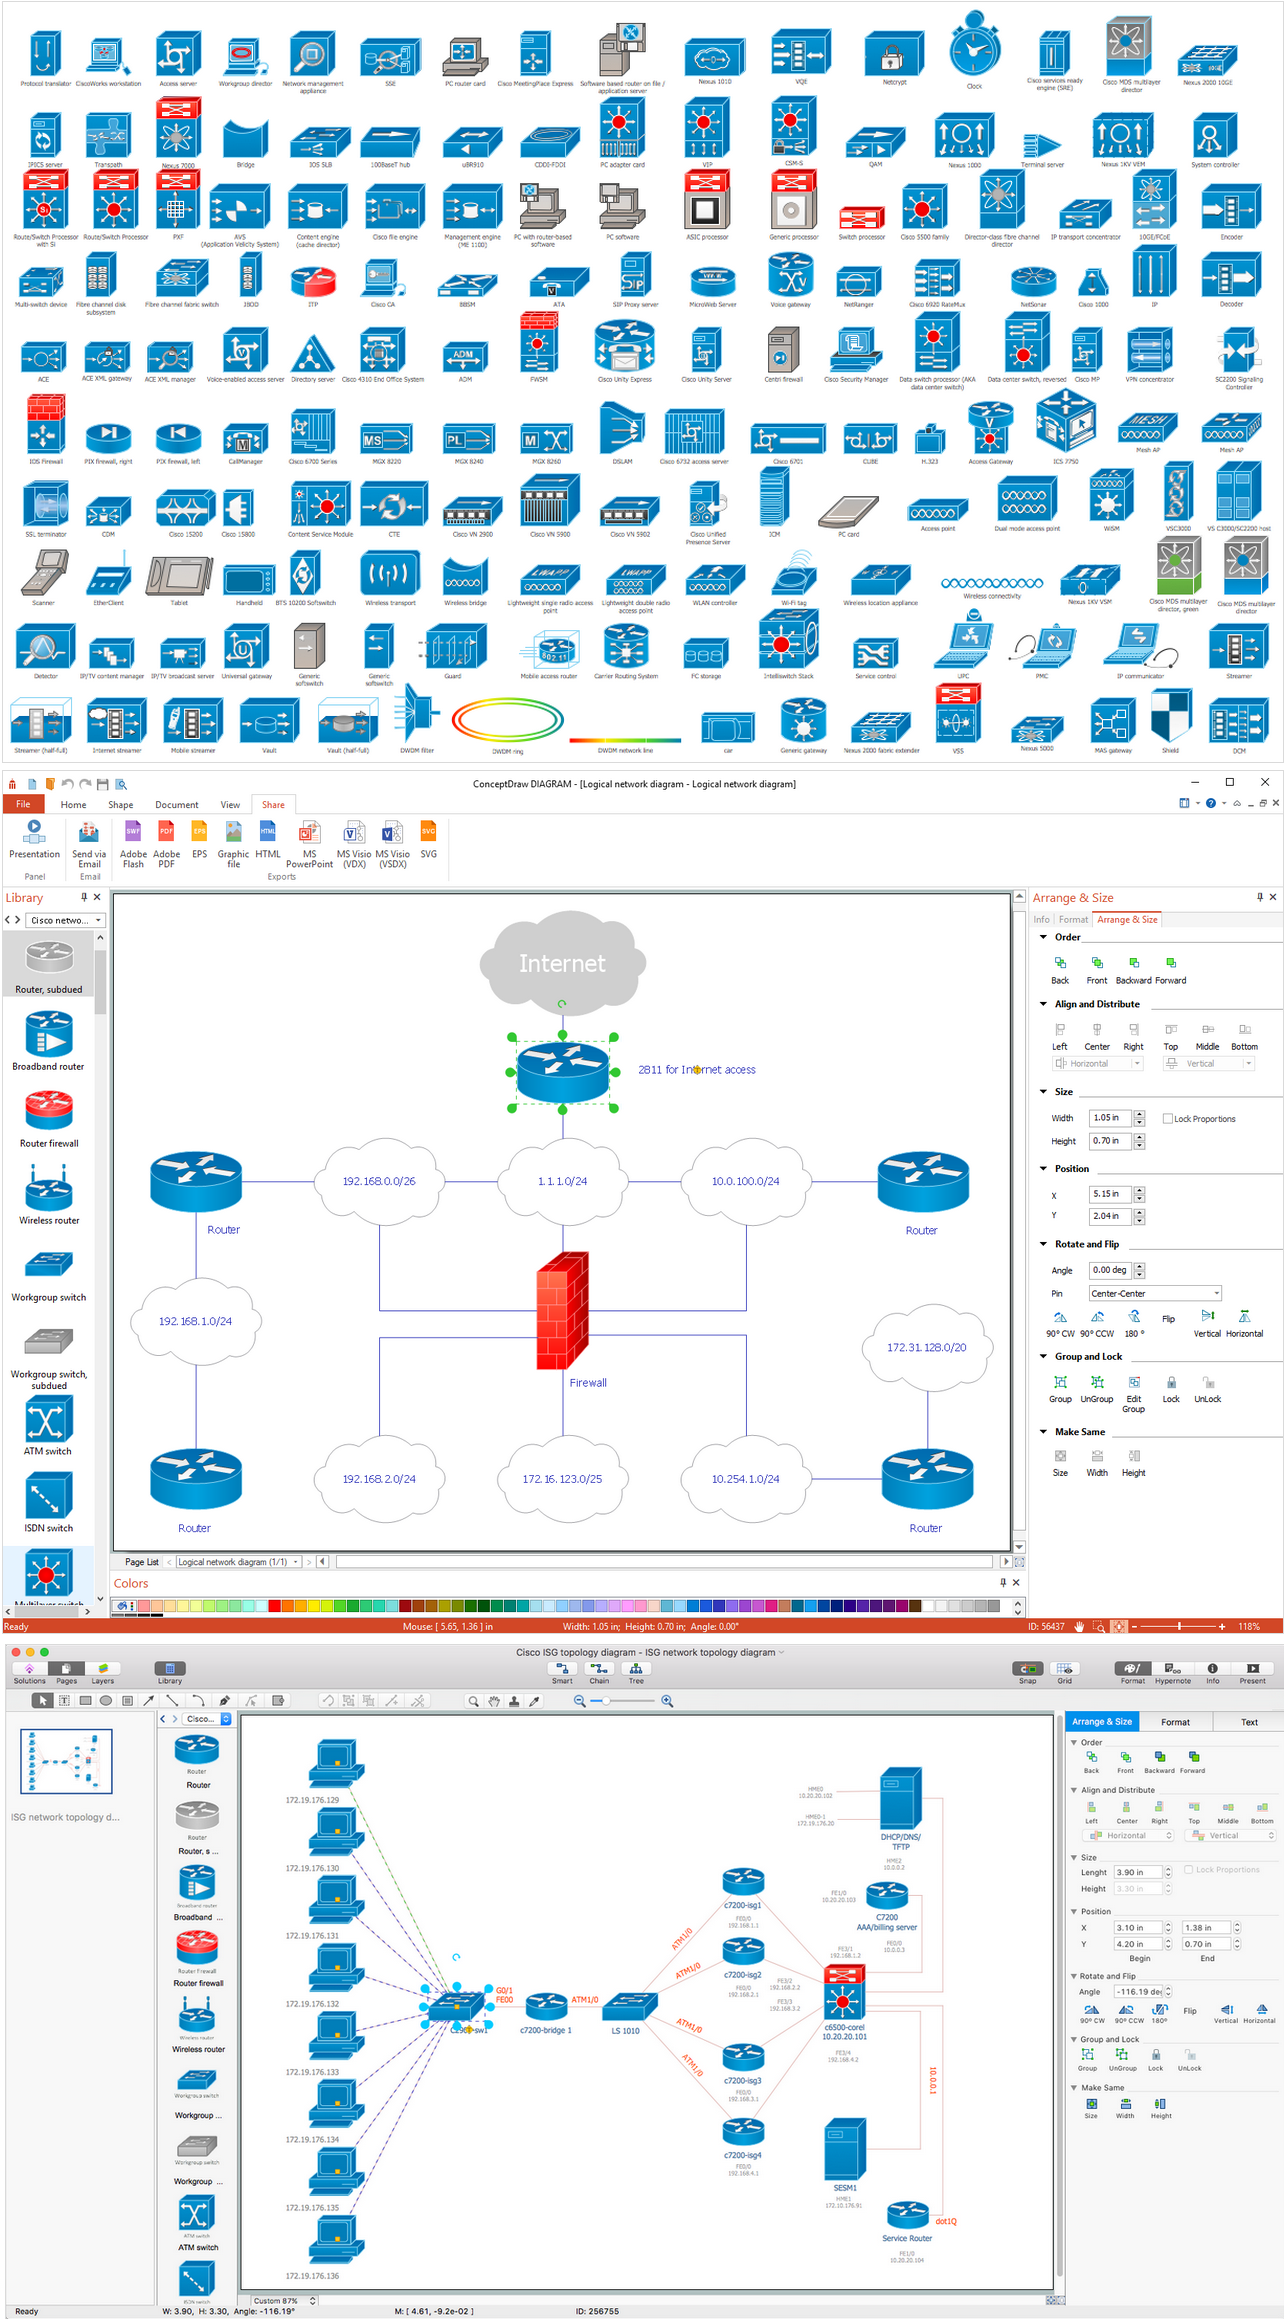
Cisco is a famous corporation that develops, manufactures and sells worldwide a networking equipment. Cisco Network Diagrams are intended to document the topology, to visualize Cisco networks, to illustrate the arrangement and connections of network equipment, using the own brand Cisco network symbols, generally accepted as standard. The Cisco icons depict specific Cisco network equipment and connections lines, the style of which specifies the type of physical connection. These diagrams are globally recognized, are often created and used by network and system administrators, network designers, and other numerous IT professionals and corporate IT departments. ConceptDraw DIAGRAM software provides the set of powerful network diagrams software tools included to the Cisco Network Diagrams solution from Computer and Networks area of ConceptDraw Solution Park. This solution offers 15 libraries with 508 cisco vector elements that are ideal for professional and easy design Cisco Network Diagrams of any configuration, complexity and detailing.
Network Icons
ConceptDraw DIAGRAM diagramming and vector drawing software is the best for drawing professional looking Computer Network Diagrams thanks to the network icons from the libraries of Computer Network Diagrams Solution from the Computer and Networks Area of ConceptDraw Solution Park.Venn Diagram Examples for Problem Solving. Computer Science. Chomsky Hierarchy
A Venn diagram, sometimes referred to as a set diagram, is a diagramming style used to show all the possible logical relations between a finite amount of sets. In mathematical terms, a set is a collection of distinct objects gathered together into a group, which can then itself be termed as a single object. Venn diagrams represent these objects on a page as circles or ellipses, and their placement in relation to each other describes the relationships between them. The Venn diagram example below visualizes the the class of language inclusions described by the Chomsky hierarchy.- Difference Between Mesh Ring Bus Star Topologies In Tabular Form
- Differences Between Star And Mesh Network Topologies
- Difference Between Mesh And Hybrid Topology
- Differences Between Hybrid And Mesh Topology
- Network topologies diagram | Compare The Mesh Tree And Star ...
- What The Difference Between Ring Topology And Mesh Topology
- Difference Between Bus Star Mesh Ring In Tabular Form
- Difference Between Ring Topology And Star Topology
- Logical network topology diagram | Difference Between Star Bus ...
- Compare Mesh And Star Topology Tabular Form

