HelpDesk
How to Create a Timeline Diagram in ConceptDraw PRO
A Timeline is a chart which displays a project plan schedule in chronological order. A Timeline is used in project management to depict project milestones and visualize project phases, and show project progress. The graphic form of a timeline makes it easy to understand critical project milestones, such as the progress of a project schedule. Timelines are particularly useful for project scheduling or project management when accompanied with a Gantt chart. It captures the main of what the project will accomplish and how it will be done. making a project timeline is one of the most important skills a project manager needs have. Making comprehensive, accurate timelines allows you getting every project off in the best way. ConceptDraw PRO allows you to draw a timeline charts using special library.Network Diagram Software Logical Network Diagram
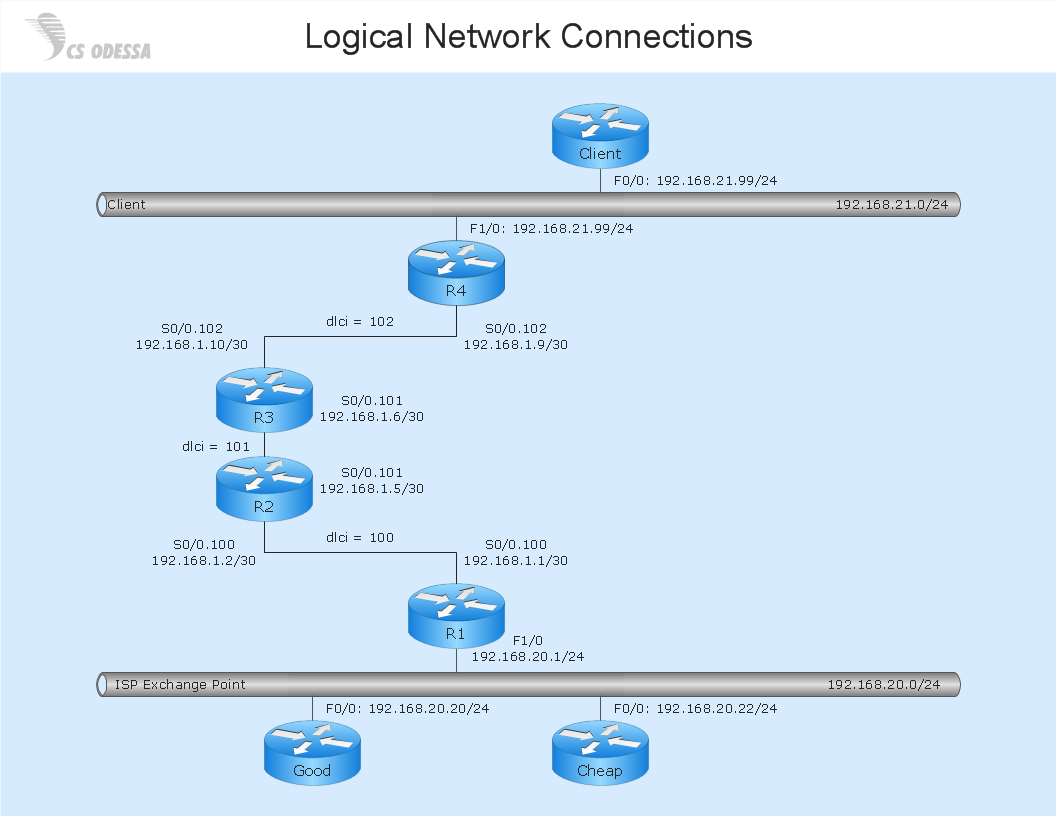
Perfect Network Diagramming Software with examples of LAN Diagrams. ConceptDraw Network Diagram is ideal for network engineers and network designers who need to draw Logical Network diagrams.
HelpDesk
How to Track Your Project Plan vs. the Actual Project Condition
Conceptdraw PROJECT provides user with the possibility to track how the project is going. Project Manager can compare the actual data with the planned and assess possible measures to resolve issues. Conceptdraw PROJECT has several types of visual reports that can help to assess visually the difference between planned and actual project data.HelpDesk
How to Use the Effort-Driven Scheduling Method
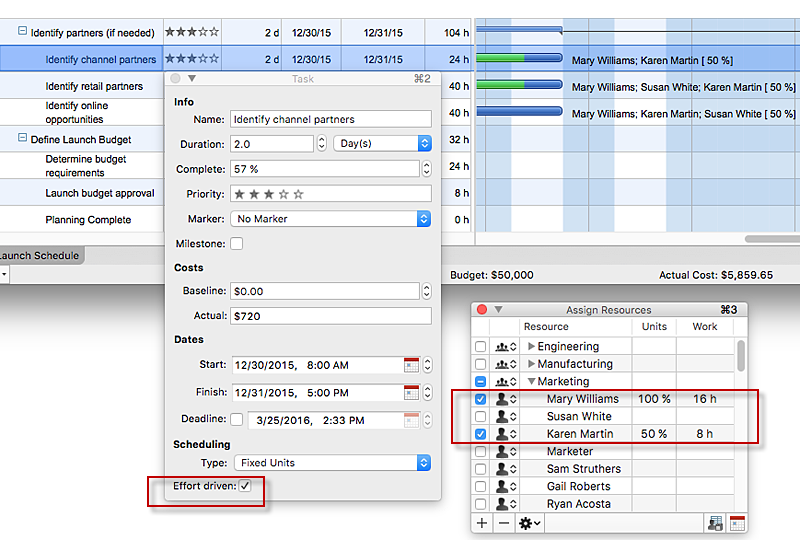
Effort-driven scheduling is the default method of project scheduling in ConceptDraw PROJECT.HelpDesk
How to Operate a Multiple Main Idea on Your Mind Map
If you are using multiple Main Ideas your maps, it is necessary to know that there is a difference in behavior between the original primary Main Idea and the other Ideas you add.HelpDesk
How to Create a Bank ATM Use Case Diagram
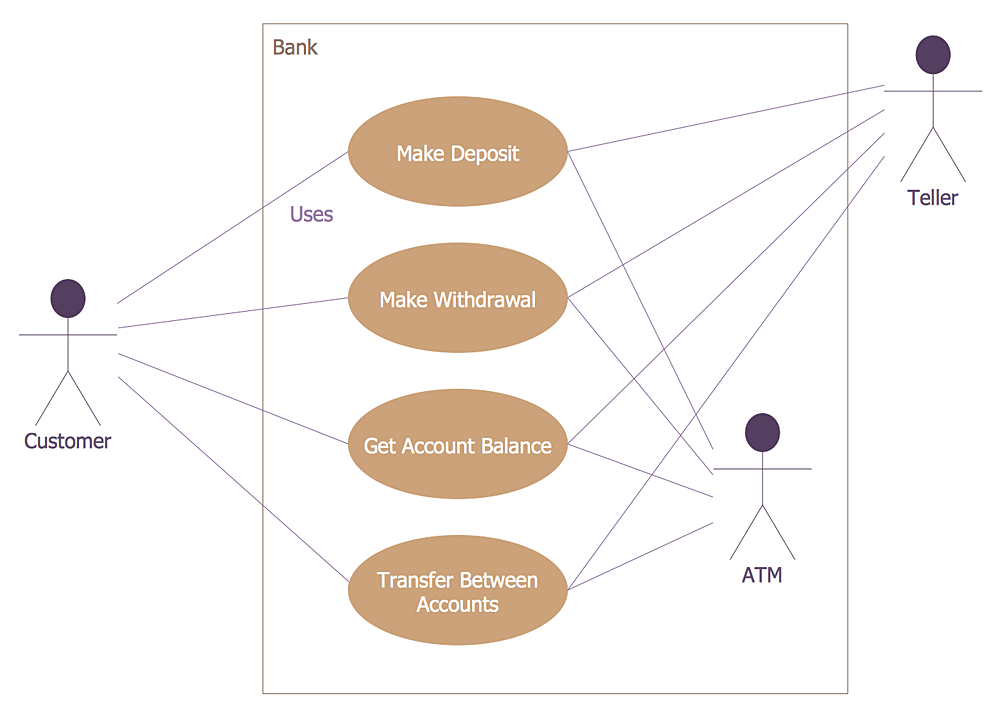
UML diagrams are often used in banking management for documenting a banking system. In particular, the interaction of bank customers with an automated teller machine (ATM) can be represented in a Use Case diagram. Before the software code for an ATM, or any other system design, is written, it is necessary to create a visual representation of any object-oriented processes. This is done most effectively by creating a Unified Modeling Language (UML) diagram, using object-oriented modeling. UML works as a general purpose modeling language for software engineers or system analysts, offering a number of different diagram styles with which to visually depict all aspects of a software system. ConceptDraw PRO diagramming software, enhanced and expanded with the ATM UML Diagrams solution, offers the full range of icons, templates and design elements needed to faithfully represent ATM and banking information system architecture using UML standards. The ATM UML Diagrams solution is useful for beginner and advanced users alike. More experienced users will appreciate a full range of vector stencil libraries and ConceptDraw PRO's powerful software, that allows you to create your ATM UML diagram in a matter of moments.HelpDesk
How to Create a Stakeholder Onion Diagram Using ConceptDraw PRO
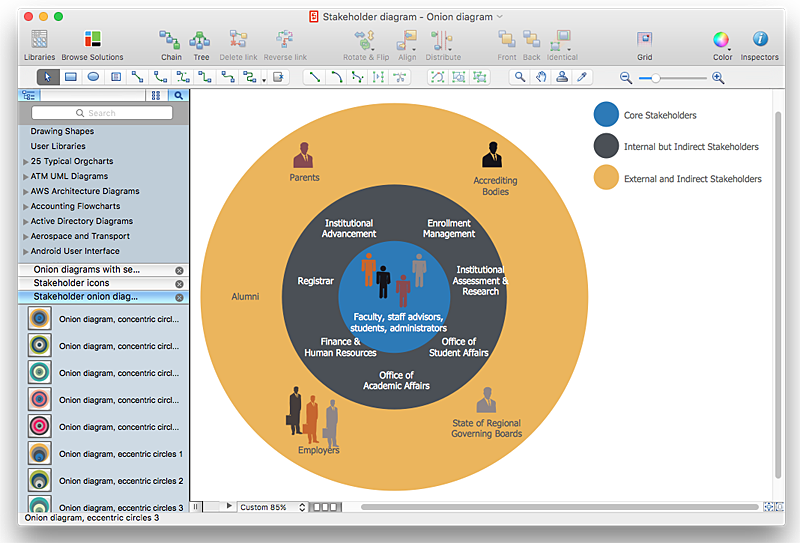
The Stakeholder Onion Diagram is stakeholder analysis tool from the arsenal of project management. It is used to display the relationships of stakeholders to a project goal. An Onion Diagram shows how the stakeholder activities affect the project results. The ConceptDraw Stakeholder Onion Diagram solution is intended to depict how the relationships that subsists in a project environment can influence on a project. A set of libraries and objects provided by this solution make ashort work of visualizing the stakeholder analysis of a project.- Diagram Physical Topologies | Network Topologies | Logical ...
- Difference Between Bus And Star Topologies
- Network Topologies | Fully Connected Network Topology Diagram ...
- Difference Between Star And Hybrid
- What Is The Difference Between Graphic Of Hybrid Network Topology
- Complete Network Topology | Fully Connected Network Topology ...
- Difference Between Network Printer And Local Printer Physical Layout
- Diagrams Showing Differences Between Wan And Man
- Hybrid Network Topology | Star Network Topology | Fully Connected ...
- Physical LAN and WAN diagram - Template | Network Diagram ...
- Differentiate Between Local Area Network Using A Sketch Of Diagram
- Differentiate Between Local Area Network And Wide Area Network
- Wide area network (WAN) topology . Computer and Network Examples
- Difference Table Between The Network Topologies
- Logical network topology diagram | Network Diagram Software ...
- Difference Between Physical And Logical Data Flow Diagram
- Wide area network (WAN) topology . Computer and Network Examples
- Difference Between Lan Wan Man Pan Ppt
- Bus Network Topology | Network Topologies | Fully Connected ...
- Difference Between Logical And Physical Data Flow Diagram


