HelpDesk
How to Draw the Different Types of Pie Charts
Using the Pie Chart, you can visually estimate the relative contribution that different data categories contribute to a whole value. The pie chart displays the statistics in a visual format. The main use of pie charts to show comparisons. The larger piece of the pie, the more the value of this value compared to the rest. Various applications of pie charts can be found in business and education. For business, pie charts can be used to compare the success or failure of the goods or services. They may also be used to display the business market share.HelpDesk
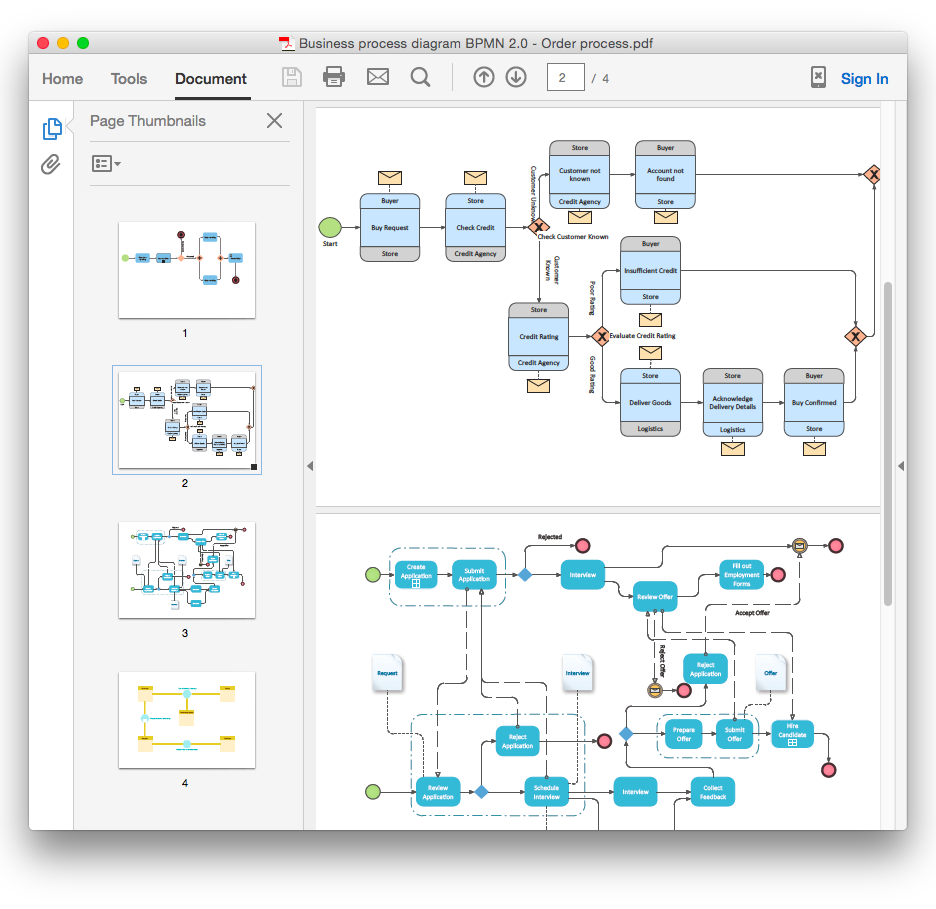
How To Convert a Business Process Diagram to Adobe PDF Using ConceptDraw PRO
ConceptDraw PRO allows you to easy exchange your business process diagrams between different computers with different operating systems and applications using it's export capabilities. You can get clear business process documentation in pdf format and avoid any problems while communicating it with stakeholders.HelpDesk
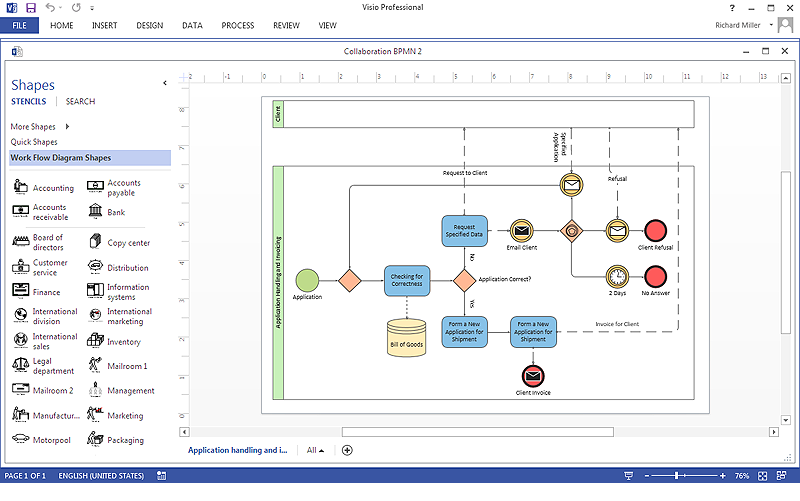
How To Create a MS Visio Business Process Diagram Using ConceptDraw PRO
Business process diagrams are specialized types of flowcharts based on the Business Process Model and Notation. The BPMN specification describes the symbols to display business processes in the form of business process diagrams. The main objective of BPMN is to create a standard set of symbols that are understandable to all business users, such as business analysts who create and improve processes, technical developers responsible for implementing processes and managers who take care processes and control them. Making a business process diagram involves many different elements that can be managed using ConceptDraw PRO. The ability to design Business process diagrams is delivered by the Business Process Diagrams solution. ConceptDraw PRO supports export of business process diagrams to MS Visio files. Thus, you can share your business documentation with MS Visio users.HelpDesk
How to Draw a Pie Chart Using ConceptDraw PRO
A pie chart represents data, in a clear and easy to read round (pie) form. A circular pie chart is divided into sections (slice). Each "slice" depicts the It reflects the proportion of each component in the whole "pie". This type of chart is most often used for the visualization of statistical data. That is why pie charts are widely used in marketing. As pie charts show proportional proportional parts of a whole, they are good for various visual comparisons. For example, it is difficult to imagine a more intuitive way to show segmentation and market share. ConceptDraw PRO allows you to draw a simple and clear Pie Chart using the Pie Charts solution.HelpDesk
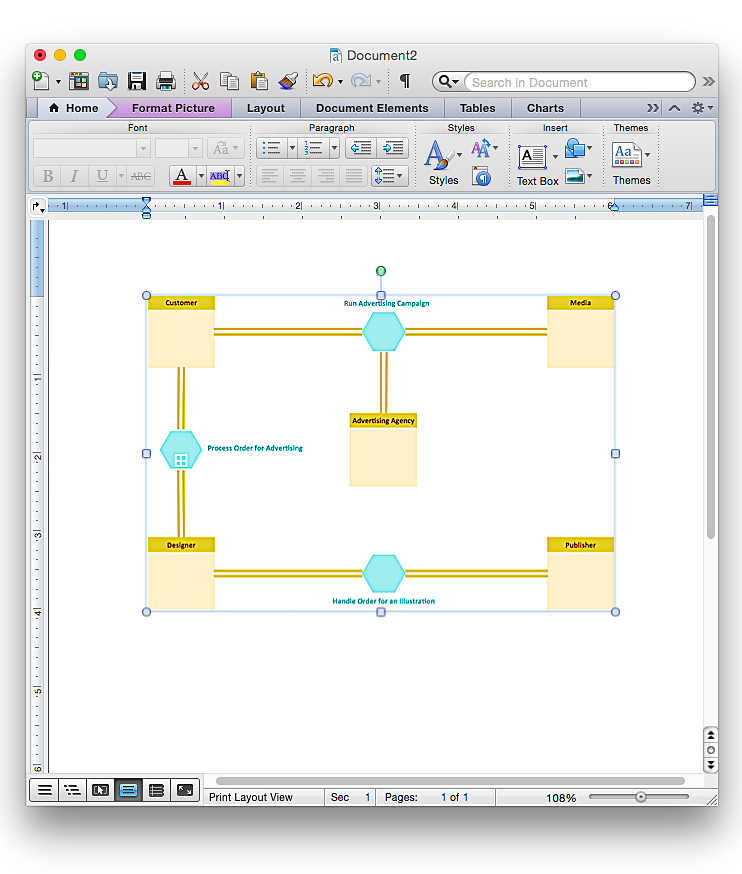
How to Add a Business Process Diagram to a MS Word Document Using ConceptDraw PRO
ConceptDraw PRO allows you to easily create business process diagrams and then add them to a MS Word document.- Business Models | Types of Flowcharts | Business Process ...
- Business Models | Types of Flowcharts | How to Create a Business ...
- Business Models | Business Process Modeling Notation Template ...
- Types of Flowcharts | Types of Flowchart - Overview | Basic ...
- Business Process Diagrams | Business Process Mapping — How to ...
- Process Flowchart | Business Models | Business Process Modeling ...
- Business Process Modeling Notation Template | Business Process ...
- Business Process Diagrams
- Business and Finance | Process Flowchart | Business and Finance ...
- Business Process Flowchart
- Flow Chart Of Business Model
- Business Process Modeling Notation Template | Business Process ...
- Business Process Diagrams | Process Flowchart | Business Process ...
- Inverted Pyramid Business Model
- Business Process Diagrams | Business Process Modeling Notation ...
- Illustrate Types Of Finance Using A Diagram
- Model Workflow
- Process Flowchart | Types of Flowcharts | Business Process ...
- Types of Flowcharts | BPMN 2.0 | Business Process Diagrams ...
- Business Process Diagrams | Types of Flowcharts | Business ...


