Bubble diagrams in Landscape Design with ConceptDraw DIAGRAM
Bubble Diagrams are the charts with a bubble presentation of data with obligatory consideration of bubble's sizes. They are analogs of Mind Maps and find their application at many fields, and even in landscape design. At this case the bubbles are applied to illustrate the arrangement of different areas of future landscape design, such as lawns, flowerbeds, playgrounds, pools, recreation areas, etc. Bubble Diagram helps to see instantly the whole project, it is easy for design and quite informative, in most cases it reflects all needed information. Often Bubble Diagram is used as a draft for the future landscape project, on the first stage of its design, and in case of approval of chosen design concept is created advanced detailed landscape plan with specification of plants and used materials. Creation of Bubble Diagrams for landscape in ConceptDraw DIAGRAM software is an easy task thanks to the Bubble Diagrams solution from "Diagrams" area. You can use the ready scanned location plan as the base or create it easy using the special ConceptDraw libraries and templates.
 Crystal Mapping
With Crystal Mapping all goals and relevant information can be observed in one radiant dashboard.
Product Overview
ConceptDraw DIAGRAM offers a wide choice of powerful and easy-to-use tools for quickly creating all kinds of charts and diagrams. Even if you've never used a drawing tool before, it's very easy to create high-quality professional graphic documents with ConceptDraw DIAGRAM.
 Bar Graphs
The Bar Graphs solution enhances ConceptDraw DIAGRAM functionality with templates, numerous professional-looking samples, and a library of vector stencils for drawing different types of Bar Graphs, such as Simple Bar Graph, Double Bar Graph, Divided Bar Graph, Horizontal Bar Graph, Vertical Bar Graph, and Column Bar Chart.
 Wireless Networks
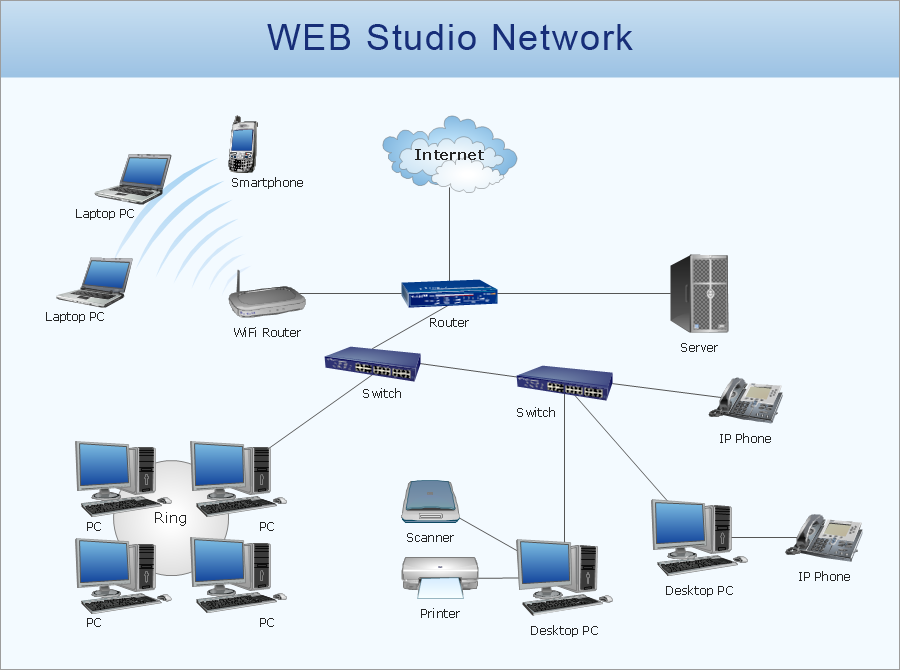
The Wireless Networks Solution extends ConceptDraw DIAGRAM software with professional diagramming tools, set of wireless network diagram templates and samples, comprehensive library of wireless communications and WLAN objects to help network engineers and designers efficiently design and create Wireless network diagrams that illustrate wireless networks of any speed and complexity, and help to identify all required equipment for construction and updating wireless networks, and calculating their costs.
 Dashboards Area
Solutions from the area Dashboards of ConceptDraw Solution Park collects templates, samples and vector stencils libraries with of data driven charts and indicators for drawing the basic types of Visual Dashboards.
Network Printer
Special libraries of highly detailed, accurate shapes and computer graphics, servers, hubs, switches, printers, mainframes, face plates, routers etc.
- Workflow to Make a Purchase | Accounting Flowcharts | Types of ...
- Work Flow Process Chart | How to Design a Good Workflow ...
- Work Flow Process Chart | Create Workflow Diagram | Drawing ...
- Simple & Fast Diagram Software | Work Flow Process Chart ...
- Workflow Diagram Software Mac | Best Program to Make Workflow ...
- How to Draw an Effective Workflow | How to Draw Workflow Diagram ...
- How to Design a Good Workflow | Work Flow Process Chart ...
- Marketing and Sales Organization chart. Organization chart Example
- Website KPIs - Visual dashboard | KPIs and Metrics | Sales KPIs ...
- Winter Sports | Winter Sports. Using Winter Sports Design Elements ...
- Workflow Diagrams | Workflow Diagram Software Mac | Work Flow ...
- Workflow Diagram Software Mac | Work Flow Diagrams with ...
- Workflow Diagram Software Mac | Work Flow Process Chart ...
- Types of Map - Overview | Hotel locator map | UML Diagram Types |
- Flow Diagram Software | Process Flowchart | Good Flow Chart app ...
- Flow Chart Symbols | Basic Flowchart Symbols | Best Flowchart ...
- Workflow Diagram Software Mac | Work Flow Process Chart | Best ...
- Work Flow Process Chart | Design elements - Picture graphs ...
- Workflow Diagram Template | Business Processes | Workflow ...
- Workflow Diagram Template | Workflow Diagrams | Work Flow ...


