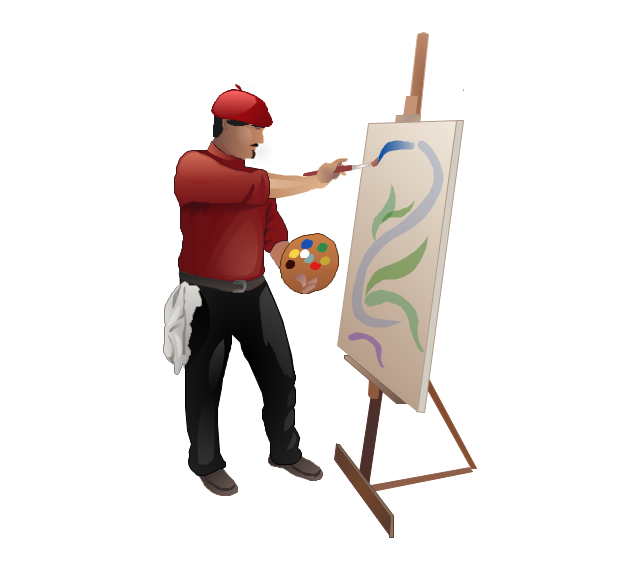
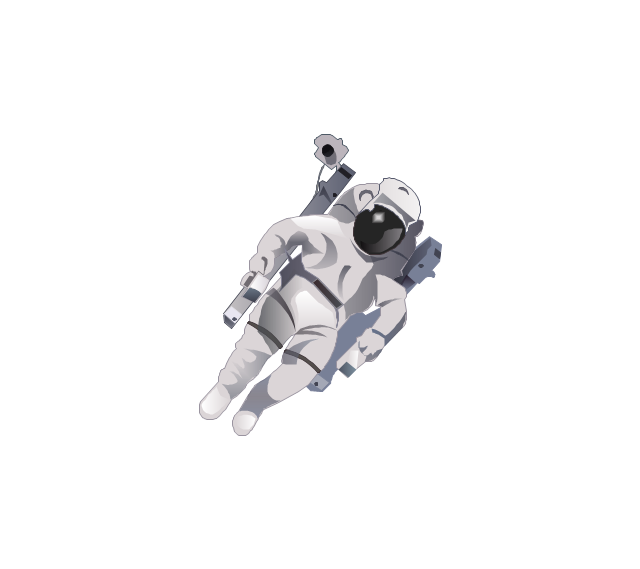
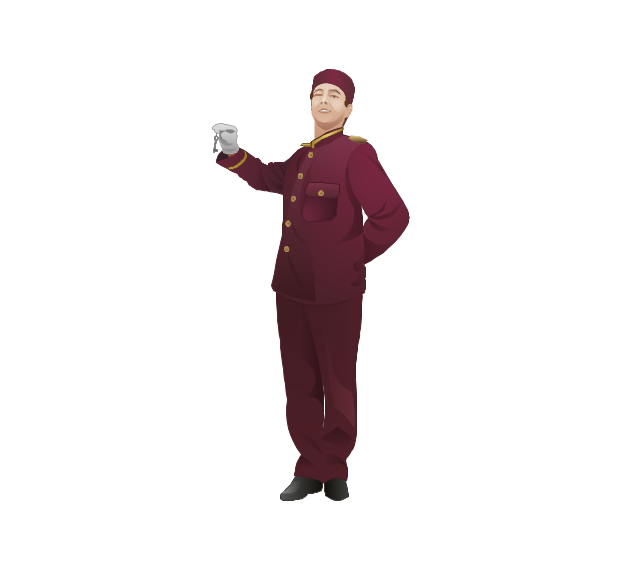
The vector stencils library "Professions" contains 58 people clipart images of different professions you can use in your presentations, illustrations and infographics.
"Electronic clip art is available in several different file formats. It is important for clip art users to understand the differences between file formats so that they can use an appropriate image file and get the resolution and detail results they need.
Clip art file formats are divided into 2 different types: bitmap or vector graphics. ...
In contrast to the grid format of bitmap images, Vector graphics file formats use geometric modeling to describe an image as a series of points, lines, curves, and polygons. Because the image is described using geometric data instead of fixed pixels, the image can be scaled to any size while retaining "resolution independence", meaning that the image can be printed at the highest resolution a printer supports, resulting in a clear, crisp image. Vector file formats are usually superior in resolution and ease of editing as compared to bitmap file formats, but are not as widely supported by software and are not well-suited for storing pixel-specific data such as scanned photographs. In the early years of electronic clip art, vector illustrations were limited to simple line art representations." [Clip art. Wikipedia]
The clip art example "Professions - Vector stencils library" was created using the ConceptDraw PRO diagramming and vector drawing software extended with the People solution from the Illustration area of ConceptDraw Solution Park.
www.conceptdraw.com/ solution-park/ illustrations-people
HelpDesk
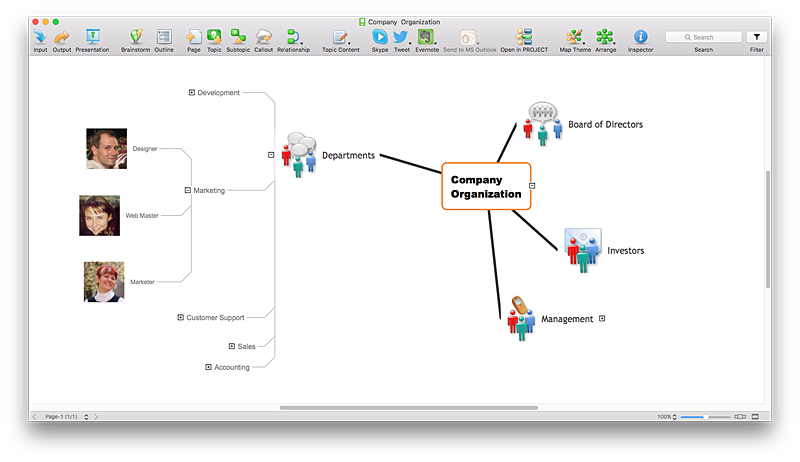
How to Create a Custom Library
Why do people use custom clipart to create their mind maps? First, this allows you to create your author's style. Making a mind map is a creative work, and each mind map depicts the personality of its author. More, the custom clipart is needed if your mind map often contains the same set of custom images that are not supplied with standard software package. ConceptDraw MINDMAP allows you to create a custom clip art library to increase the visual capacity of your mind maps. You can even deploy them inside ConceptDraw MINDMAP so that you can use them through standard interface tools.
 Pie Charts
Pie Charts are extensively used in statistics and business for explaining data and work results, in mass media for comparison (i.e. to visualize the percentage for the parts of one total), and in many other fields. The Pie Charts solution for ConceptDraw PRO v10 offers powerful drawing tools, varied templates, samples, and a library of vector stencils for simple construction and design of Pie Charts, Donut Chart, and Pie Graph Worksheets.
 Venn Diagrams
Venn Diagrams are actively used to illustrate simple set relationships in set theory and probability theory, logic and statistics, mathematics and computer science, linguistics, sociology, and marketing. Venn Diagrams are also often used to visually summarize the status and future viability of a project.
- Business People Clipart | Professions - Vector stencils library ...
- Pictures Of Professions
- Clipart Of Different Professions
- Professions - Vector stencils library | Female Manager Png Photos
- Professions - Vector stencils library | How to Connect an Image to a ...
- Professions - Vector stencils library | HR professions - Vector ...
- Professions - Vector stencils library | Illustration | People | Different ...
- Vector Png Images
- Professions - Vector stencils library | How to Change the Font for an ...
- Professions - Vector stencils library | Project management - Design ...
- Professions - Vector stencils library | Entity-Relationship Diagram ...
- Professions - Vector stencils library | People | Illustration | People ...
- ConceptDraw Solution Park | Professions - Vector stencils library ...
- Professions - Vector stencils library | Post and Mail - Vector stencils ...
- Professions - Vector stencils library | Process Flowchart | Entity ...
- Sales Flowcharts | Business People Clipart | Professions - Vector ...
- Professions - Vector stencils library | Daisy Chain Network Topology ...
- Internet marketing professions | HR professions - Vector stencils ...
- Design elements - Aircraft | Professions - Vector stencils library ...

