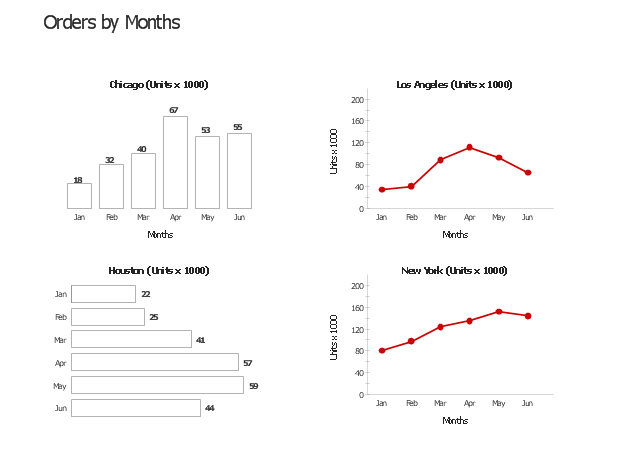
"Digital dashboards allow managers to monitor the contribution of the various departments in their organization. To gauge exactly how well an organization is performing overall, digital dashboards allow you to capture and report specific data points from each department within the organization, thus providing a "snapshot" of performance.
Benefits of using digital dashboards include:
Visual presentation of performance measures.
Ability to identify and correct negative trends.
Measure efficiencies/ inefficiencies.
Ability to generate detailed reports showing new trends.
Ability to make more informed decisions based on collected business intelligence.
Align strategies and organizational goals.
Saves time compared to running multiple reports.
Gain total visibility of all systems instantly.
Quick identification of data outliers and correlations." [Dashboard (management information systems). Wikipedia]
The business performance dashboard example "Orders by months - Digital dashboard" was created using the ConceptDraw PRO diagramming and vector drawing software extended with the Time Series Dashboard solution from the area "What is a Dashboard" of ConceptDraw Solution Park.
- Column Chart Dashboard
- Bar Chart Dashboard
- Gauges Chart
- Gauges Chart Example
- Gauge Dashboard Design
- Gauge Chart
- Gauges Chart Software
- Circle Gauge Graph Design
- Dashboard Of Bar Charts
- Management indicators - Vector stencils library | Design elements ...
- Gauge Charts
- Dashboard Gauges
- Column Yellow Chart
- Bars Gauge Chart
- Performance Indicators | Design elements - Meter indicators ...
- Performance Indicators | Design elements - Composition charts and ...
- Management indicators - Vector stencils library | Design elements ...
- Dashboard Bar Speedometer
- Design elements - Meter indicators | Sales performance dashboard ...
- Column Chart Software | Line Graph Charting Software | Bar Chart ...
