Types of Flowcharts


Design Element: Crows Foot for Entity Relationship Diagram - ERD

Diagramming tool - Amazon Web Services and Cloud Computing Diagrams

UML Diagram for System

Affinity Diagram

Software Work Flow Process in Project Management with Diagram

This sample shows the Workflow Diagram that clearly illustrates stages a BPM consists of and relations between all parts of business. The Workflow Diagrams are used to represent the transferring of data during the work process, to study and analysis the working processes, and to optimize a workflow.
Diagramming Software for Design UML Package Diagrams


Object-Oriented Design

Metropolitan area networks (MAN). Computer and Network Examples
. Computer and Network Examples")

Total Quality Management Density

Garrett IA Diagrams with ConceptDraw DIAGRAM

Workflow Application

Software development with ConceptDraw products

Sprint Review (Demo)
 *")
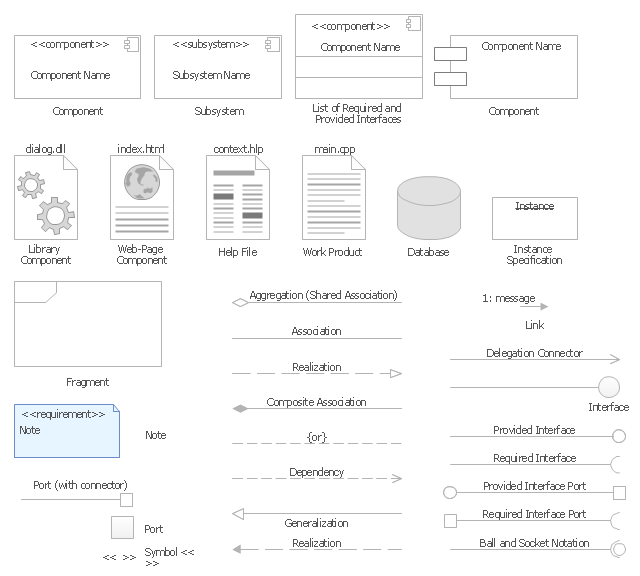
The vector stencils library "UML component diagrams" contains 36 symbols for the ConceptDraw PRO diagramming and vector drawing software.
"In the Unified Modeling Language, a component diagram depicts how components are wired together to form larger components and or software systems. They are used to illustrate the structure of arbitrarily complex systems. ...
Symbols.
This may have a visual stereotype in the top right of the rectangle of a small rectangle with two even smaller rectangles jutting out on the left.
The lollipop, a small circle on a stick represents an implemented or provided interface. The socket symbol is a semicircle on a stick that can fit around the lollipop. This socket is a dependency or needed interface." [Component diagram. Wikipedia]
The example "Design elements - UML component diagrams" is included in the Rapid UML solution from the Software Development area of ConceptDraw Solution Park.
UML component diagram symbols
The vector stencils library "Computer network" contains 51 symbols of computer network devices and equipment for drawing computer network diagrams.
"Network Mapping Software.
A number of software tools exist to design computer network diagrams / or generate visual maps of networks, servers, storage, services, data centers, and other peripherals. Broadly, there are two types of software tools - those that help create diagrams manually and those that generate them using automated / semi-automated approaches.
Type of Software.
(1) Manual - allows users to design and draw logical and physical topology diagrams by manually placing icons and connections.
(2) Automated - generate topology diagrams / maps by traversing the network and automatically discovering resident devices or by importing network data." [Comparison of network diagram software. Wikipedia]
ConceptDraw PRO is the software for manual design of computer network diagrams. The solutions of the Computer and Networks area in ConceptDraw Solution Park extend ConceptDraw PRO with vector stencils libraries, templates and examples for creating the computer network diagrams.
The symbols example "Computer network - Vector stencils library" was created using the ConceptDraw PRO diagramming and vector drawing software extended with the Computer and Networks solution from the Computer and Networks area of ConceptDraw Solution Park.
www.conceptdraw.com/ solution-park/ computer-and-networks
Laptop

Desktop computer

Firewall

Bus

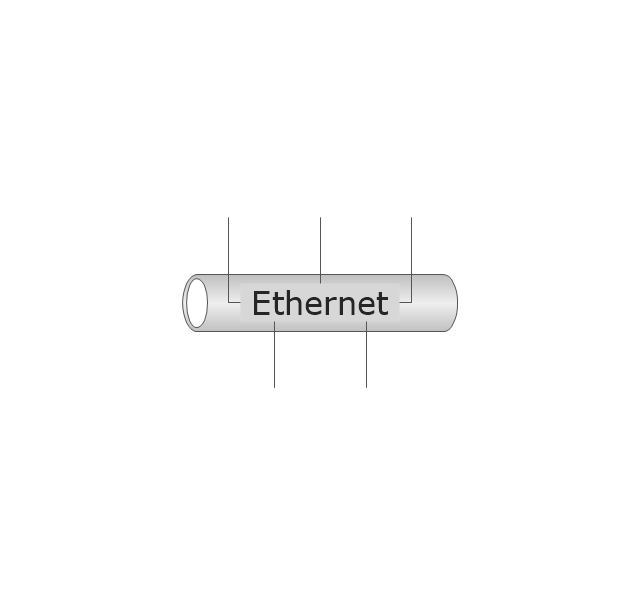
Ethernet
Star network

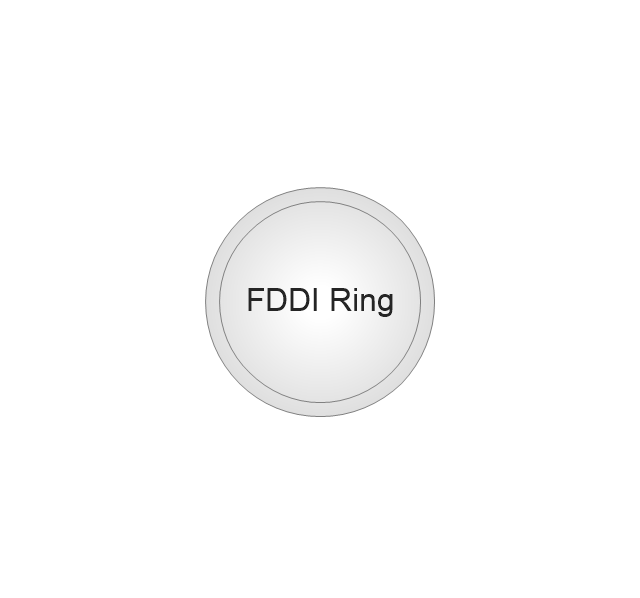
FDDI Ring
Token-ring

Comm-link

Modem

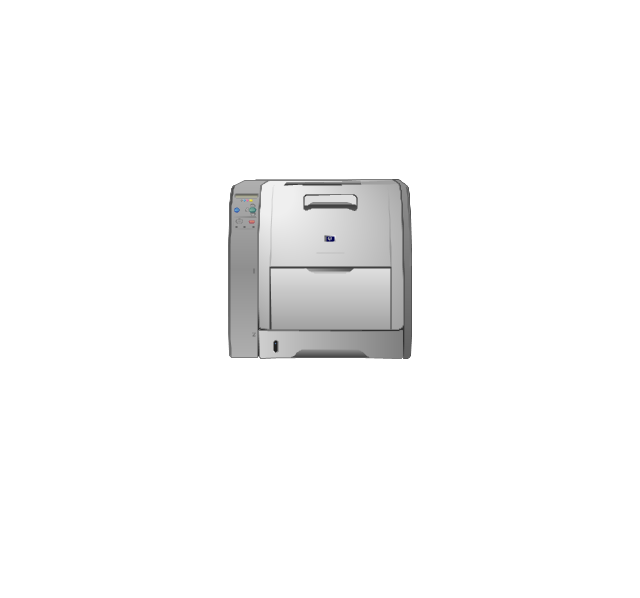
Laser printer
Inkjet printer
Image scanner

City

Ethernet hub

Wireless router

Network switch

iPod Classic

iPhone/ iPod Touch

Xserve RAID
XServe

Apple Thunderbolt Display

Data store
Mac Pro

iMac

RAID

Mainframe

Rack-mountable server

Server

PDA

Cloud

Computer monitor

Workstation

Router
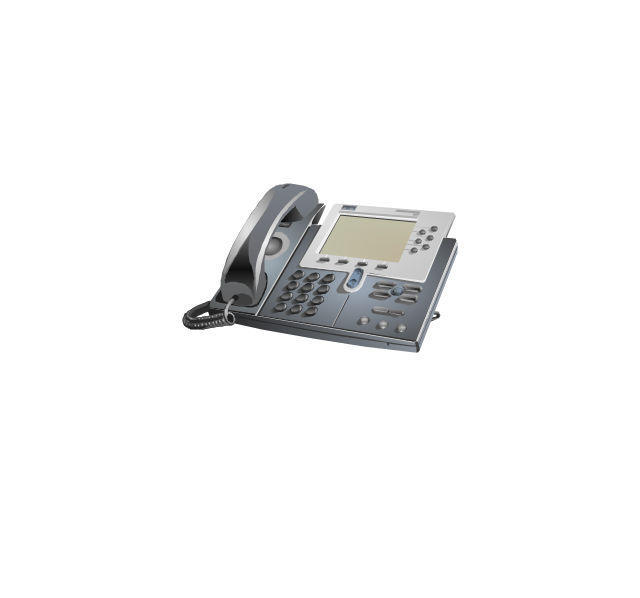
IP Phone
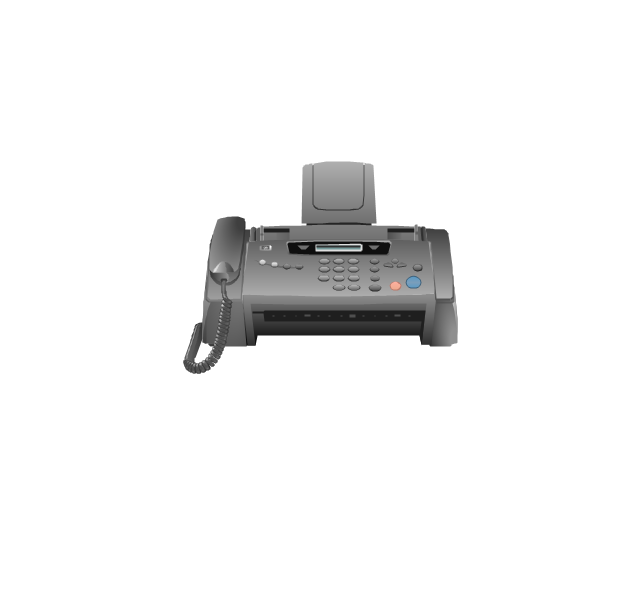
Fax
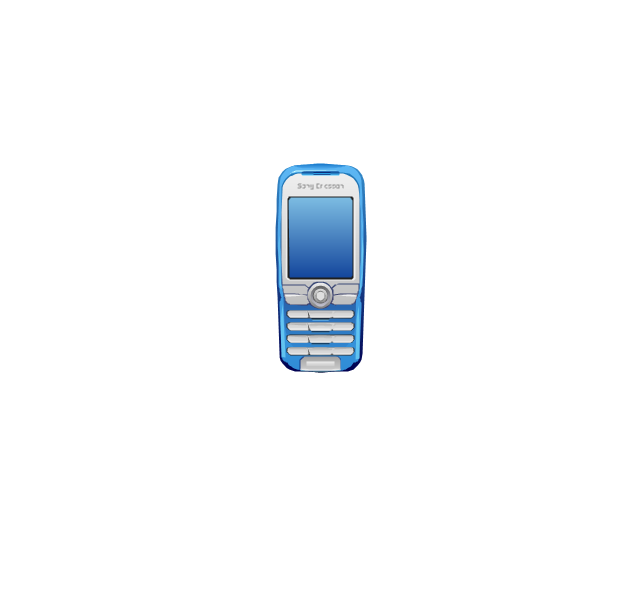
Mobile phone
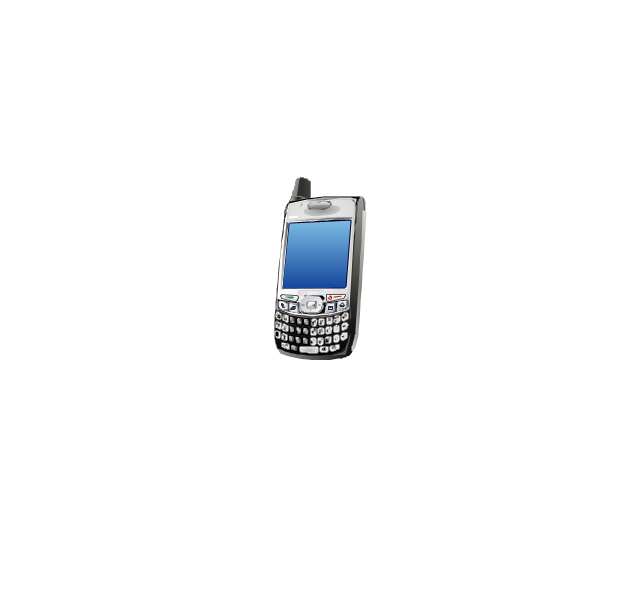
Smartphone
Compact Disk

Mouse

Apple Wireless Mouse

Computer keyboard
Apple Keyboard

Radio tower

Satellite dish

Satellite

Webcam
AirPort Extreme

Airport Express
MacBook

iPhone 4

"Crow's Foot notation is used in Barker's Notation, SSADM and Information Engineering. Crow's Foot diagrams represent entities as boxes, and relationships as lines between the boxes. Different shapes at the ends of these lines represent the cardinality of the relationship." [Entity–relationship model. Wikipedia]
The vector stencils library ERD, crow's foot notation contains 18 symbols for creating the ER-diagrams using the ConceptDraw PRO diagramming nd vector drawing software.
The example"Design elements - ERD solution (crow's foot notation)" is included in the Entity-Relationship Diagram (ERD) solution from the Software Development area of ConceptDraw Solution Park.
Crow's foot ERD
.png--diagram-flowchart-example.png)
Data Flow Diagram

Data structure diagram with ConceptDraw DIAGRAM

 Food Court
Use the Food Court solution to create food art. Pictures of food can be designed using libraries of food images, fruit art and pictures of vegetables.
- Entity Relationship Diagram Symbols | ERD Symbols and Meanings ...
- Components of ER Diagram | E-R Diagrams | Entity Relationship ...
- Components of ER Diagram | Entity Relationship Diagram Software ...
- Components of ER Diagram | Entity Relationship Diagram Symbols ...
- ERD Symbols and Meanings | Entity Relationship Diagram Symbols ...
- Entity Relationship Diagram Symbols | Competitor Analysis | Players ...
- UML Class Diagram . Design Elements | UML Package Diagram ...
- Types of Flowcharts | Entity Relationship Diagram Symbols ...
- Entity-Relationship Diagram (ERD) | Martin ERD Diagram | Data ...
- Entity Relationship Diagram Symbols | Entity Relationship Diagram ...
- UML class diagram - Bank account | How to Create a Bank ATM Use ...
- Martin ERD Diagram | Components of ER Diagram | How to Draw ...
- How To Create the Interaction (Relations) Diagram | PROBLEM ...
- UML use case diagram - Banking system | How to Create a Bank ...
- UML Diagrams with ConceptDraw DIAGRAM | Local area network ...
- Entity Relationship Diagram Examples
- Entity Relationship Diagram Symbols
- Flowchart Marketing Process. Flowchart Examples | Examples of ...
- How to Add a Network Diagram to MS Word | Office Layout Plans ...
- How to Add a Block Diagram to a PowerPoint Presentation ...