Beauty in nature Illustrations and Clipart

The vector stencils library "Citric acid cycle (TCA cycle)" contains 26 symbols of metabolites for drawing metabolic pathway maps and biochemical shematic diagrams of the citric acid cycle (TCA cycle, tricarboxylic acid cycle, Krebs cycle) and diagrams of metabolism processes.
"The citric acid cycle - also known as the tricarboxylic acid cycle (TCA cycle), or the Krebs cycle, - is a series of chemical reactions used by all aerobic organisms to generate energy through the oxidation of acetate derived from carbohydrates, fats and proteins into carbon dioxide and chemical energy in the form of adenosine triphosphate (ATP). In addition, the cycle provides precursors of certain amino acids as well as the reducing agent NADH that is used in numerous other biochemical reactions. Its central importance to many biochemical pathways suggests that it was one of the earliest established components of cellular metabolism and may have originated abiogenically.
The name of this metabolic pathway is derived from citric acid (a type of tricarboxylic acid) that is consumed and then regenerated by this sequence of reactions to complete the cycle. In addition, the cycle consumes acetate (in the form of acetyl-CoA) and water, reduces NAD+ to NADH, and produces carbon dioxide as a waste byproduct. The NADH generated by the TCA cycle is fed into the oxidative phosphorylation (electron transport) pathway. The net result of these two closely linked pathways is the oxidation of nutrients to produce usable chemical energy in the form of ATP." [Citric acid cycle. Wikipedia]
The shapes example "Design elements - TCA cycle" is included in the Biology solution from the Science and Education area of ConceptDraw Solution Park.
Tricarboxylic acid cycle (Krebs cycle) symbols
-symbols--design-elements---tca-cycle.png--diagram-flowchart-example.png)
The cycle diagram sample was created on the base of the figure illustrating the webpage "2. POLICY & STRATEGY" of "Scottish Police College Primary Inspection 2006: A Report by Her Majesty's Inspectorate of Constabulary" from the Scottish Government website.
"Strategic Planning.
2.1 The planning process for the College currently follows a structured approach, starting in April and extending through the financial year. The planning cycle is illustrated in figure 2. ...
2.2 The College recognises the need to consult with its customers and stakeholders in the process of setting objectives and directing the training programme. The planning cycle to date refers to force visits, environmental scanning, the course planning process which involves consultation with all forces and other common police services, as well as to a survey of external providers.
2.3 The information from consultation feeds into an EFQM framework from which the College has identified four key policies, namely:
(1) developing and delivering quality training;
(2) developing our people through lifelong learning;
(3) continuous improvement of our service; and
(4) embracing the changing environment.
2.4 The objectives set at divisional level are designed to contribute to delivering these policies. HMIC found that whilst the selected objectives were presented in line with the structure, not all could be considered to meet SMART (Specific, Measurable, Achievable, Relevant and Timed) criteria. This failure indicates that while the process appears suitably structured to deliver a robust result, some of those involved could perhaps have a better understanding of the process." [scotland.gov.uk/ Publications/ 2007/ 02/ 15134652/ 8]
The cycle diagram example "Strategic planning" was created using the ConceptDraw PRO diagramming and vector drawing software extended with the Target and Circular Diagrams solution from the Marketing area of ConceptDraw Solution Park.
www.conceptdraw.com/ solution-park/ marketing-target-and-circular-diagrams
Cycle diagram

This circle diagram sample was redesigned from the Wikimedia Commons file: Research cycle.png. "Some of the basic elements of the scientific method, arranged in a cycle to emphasize that it is an iterative process." [commons.wikimedia.org/ wiki/ File:Research_ cycle.png]
This file is licensed under the Creative Commons Attribution 2.0 Generic license. [creativecommons.org/ licenses/ by/ 2.0/ deed.en]
"The scientific method is a body of techniques for investigating phenomena, acquiring new knowledge, or correcting and integrating previous knowledge. To be termed scientific, a method of inquiry must be based on empirical and measurable evidence subject to specific principles of reasoning. ...
Four essential elements of the scientific method are iterations, recursions, interleavings, or orderings of the following:
(1) Characterizations (observations, definitions, and measurements of the subject of inquiry).
(2) Hypotheses (theoretical, hypothetical explanations of observations and measurements of the subject).
(3) Predictions (reasoning including logical deduction from the hypothesis or theory).
(4) Experiments (tests of all of the above)...
A linearized, pragmatic scheme of the four points above is sometimes offered as a guideline for proceeding:
(1) Define a question.
(2) Gather information and resources (observe).
(3) Form an explanatory hypothesis.
(4) Test the hypothesis by performing an experiment and collecting data in a reproducible manner.
(5) Analyze the data.
(6) Interpret the data and draw conclusions that serve as a starting point for new hypothesis.
(7) Publish results.
(8) Retest (frequently done by other scientists).
The iterative cycle inherent in this step-by-step method goes from point 3 to 6 back to 3 again." [Scientific method. Wikipedia]
The circle diagram example "Research cycle" was created using the ConceptDraw PRO diagramming and vector drawing software extended with the Target and Circular Diagrams solution from the Marketing area of ConceptDraw Solution Park.
www.conceptdraw.com/ solution-park/ marketing-target-and-circular-diagrams
Circle diagram

This arrow ring diagram sample was created on the base of the figure illustrating the webpage "Grant Life Cycle" from the Georgia College website. "Grant Life Cycle.
Define Opportunity: Funding opportunities can come from anywhere: databases, agency websites, professional publications or colleagues. GC subscribes to the database GRC. Federal grant opportunities can be found through Grants.gov.
Develop Proposal: Once an opportunity has been identified OGSP will do the following:
(1) Review the announcement for application requirements.
(2) Meet with the Principal Investigator (PI) to develop a project management plan.
(3) Work up a draft budget for PI approval.
(4) Complete the sponsor/ required forms and budget justification to be included in the application.
Submit & Negotiate: Applications can only be submitted by GC or the GC Foundation. Once internal approval has been received, designated staff in the appropriate office will submit the application on behalf of the PI and institution. If awarded, the GC or Foundation personnel will review and negotiate acceptable terms and conditions to GC, GC Fdn and/ or USG.
All of these are part of Pre-award services. ...
Award Setup: OGSP will review award documentation and assist all responsible parties with their roles and responsibilities during the grant. OGSP is available through the life of the award to provide support with any non-financial issues.
Manage Subawards: If subawards were identified at application, OGSP will issue the subaward using GC approved forms. If the need for a portion of the work to be completed by an outside entity is noted in the post-award phase, the Grants Compliance Manager will secure agency approval and then issue the subaward. OGSP will monitor the fiscal aspects of the subaward while the PI is responsible for the programmatic compliance.
Execute Project: OGSP continually monitors each grant for compliance with award terms & conditions. As legal representative, OGSP works with the PI and funder to expedite reports and resolve any issues that might arise.
Close Out Project: Once a grant has reached the end of the project period, all funders have requirements for final progress and financial reports. OGSP will work with the PI to make sure the progress report is submitted in a timely fashion and the Business & Finance completes the final invoices or report. The storage of the official project file is the responsibility of OGSP. All information and reports should be copied to the Grant Compliance Manager for inclusion in the official record." [gcsu.edu/ grants/ grantlifecycle.htm]
The arrow ring diagram example "Grant life cycle" was created using the ConceptDraw PRO diagramming and vector drawing software extended with the Target and Circular Diagrams solution from the Marketing area of ConceptDraw Solution Park.
www.conceptdraw.com/ solution-park/ marketing-target-and-circular-diagrams
Arrow ring diagram
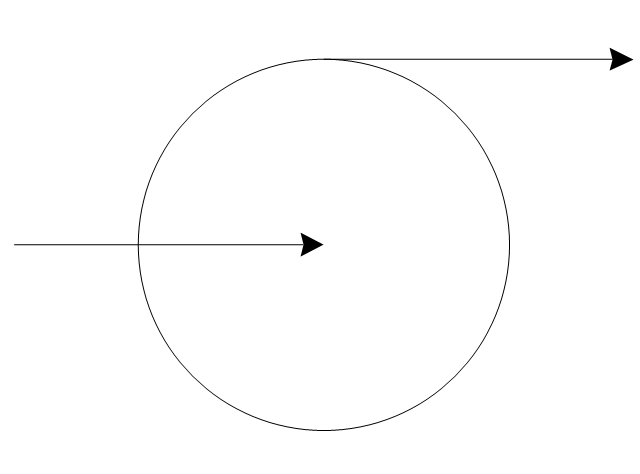
This circular arrows diagram sample shows the systems development life cycle (SDLC) stages.
"The systems development life cycle (SDLC), also referred to as the application development life-cycle, is a term used in systems engineering, information systems and software engineering to describe a process for planning, creating, testing, and deploying an information system. The systems development life-cycle concept applies to a range of hardware and software configurations, as a system can be composed of hardware only, software only, or a combination of both." [Systems development life-cycle. Wikipedia]
The arrow circle diagram example "Systems development life cycle" was created using the ConceptDraw PRO diagramming and vector drawing software extended with the Circular Arrows Diagrams solution from the area "What is a Diagram" of ConceptDraw Solution Park.
Circular arrows diagram

The vector stencils library "Circular diagrams" contains 42 templates of circular diagrams: circular arrow diagram, circular motion diagram, arrow ring chart, doughnut chart (donut chart), circle pie chart, diamond pie chart, circle diagram, pie chart, ring chart, loop diagram, block loop diagram, arrow loop circle, crystal diagram, triangular diagram, diamond diagram, pentagon diagram, hexagon diagram, heptagon diagram, cycle diagram (cycle chart), stacked Venn diagram (onion diagram), arrow circle diagram.
Use these shapes to illustrate your marketing and sales documents, presentations, webpages and infographics in the ConceptDraw PRO diagramming and vector drawing software extended with the Target and Circular Diagrams solution from the Marketing area of ConceptDraw Solution Park.
www.conceptdraw.com/ solution-park/ marketing-target-and-circular-diagrams
Circular arrow diagram 1
Circular arrow diagram 2
Arrow ring chart
Doughnut chart

Diamond pie chart

Pie chart

Circle diagram

Circle pie chart 2

Circle pie chart 1

Ring chart 1 - 3 elements

Ring chart 1 - 4 elements

Ring chart 1 - 5 elements

Ring chart 1 - 6 elements

Ring chart 1 - 7 elements

Ring chart 2 - 3 elements

Ring chart 2 - 4 elements

Ring chart 2 - 5 elements

Ring chart 2 - 6 elements

Ring chart 2 - 7 elements

Crystal diagram - 3 elements

Crystal diagram - 4 elements

Crystal diagram - 5 elements

Crystal diagram - 6 elements

Crystal diagram - 7 elements

Stacked Venn diagram - 4

Stacked Venn diagram - 5

Stacked Venn diagram - 6

Stacked Venn diagram - 7

Basic loop diagram

Block loop diagram

Arrow loop circle
Arrow loop - 3 circles
Arrow loop - 4 circles
Arrow loop - 5 circles
Arrow loop - 6 circles
Arrow loop - 7 circles
Arrow circle diagram - 3
Arrow circle diagram - 4
Stacked Venn diagram - 3

Arrow circle diagram - 5
Arrow circle diagram - 6
Arrow circle diagram - 7
Types of Flowcharts


BPR Diagram. Business Process Reengineering Example

"Citric acid cycle (tricarboxylic acid cycle, TCA cycle, Krebs cycle) is a series of chemical reactions used by all aerobic organisms to generate energy through the oxidation of acetate derived from carbohydrates, fats and proteins into carbon dioxide and chemical energy in the form of adenosine triphosphate (ATP)." [Citric acid cycle. Wikipedia]
This biochemical diagram example shows metabolic pathways map of citric acid cycle reactions.
This sample was redesigned from the Wikimedia Commons file: TCA cycle.svg. [commons.wikimedia.org/ wiki/ File:TCA_ cycle.svg]
This image is licensed under the Creative Commons Attribution 3.0 Unported license. [creativecommons.org/ licenses/ by/ 3.0/ deed.en]
The metabolic pathway map example "Citric acid cycle (TCA cycle)" was created using the ConceptDraw PRO diagramming and vector drawing software extended with the Biology solution from the Science and Education area of ConceptDraw Solution Park.
Tricarboxylic acid cycle
.png--diagram-flowchart-example.png)
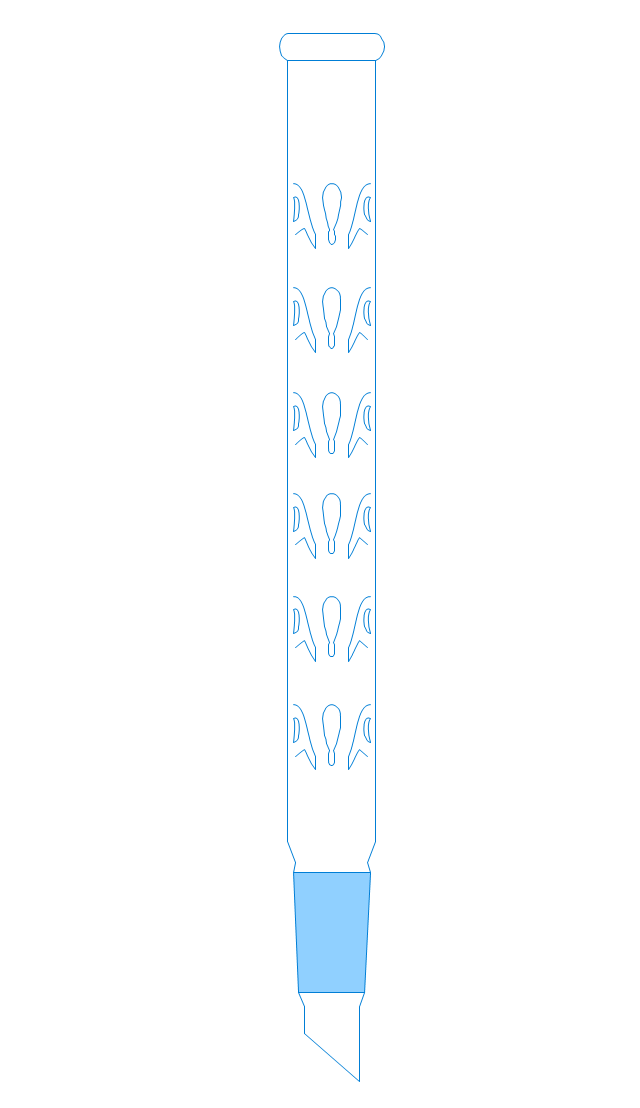
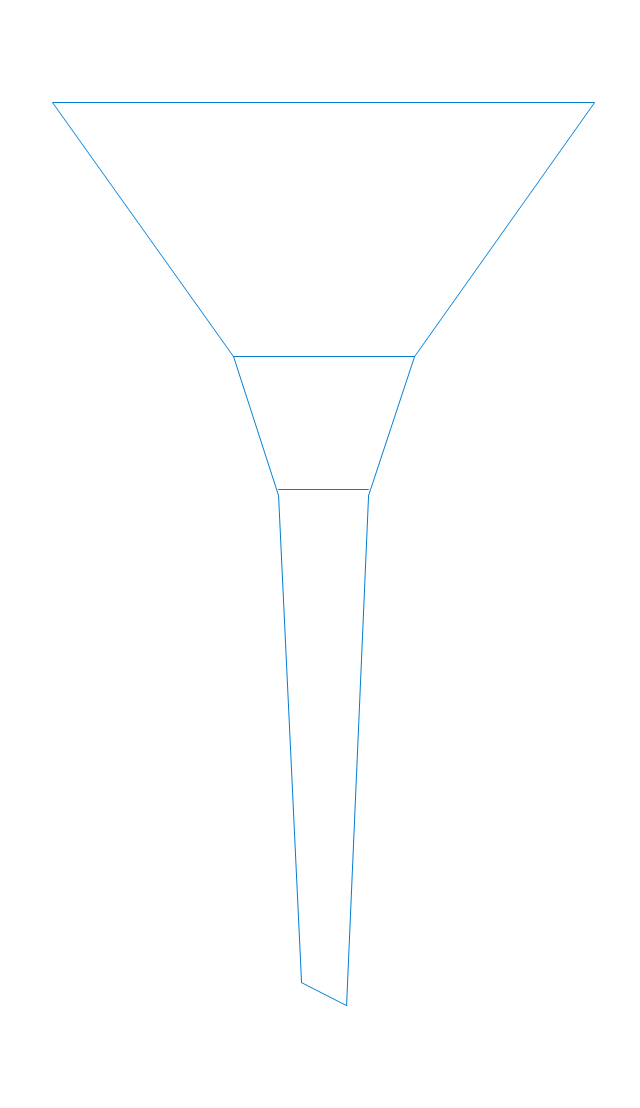
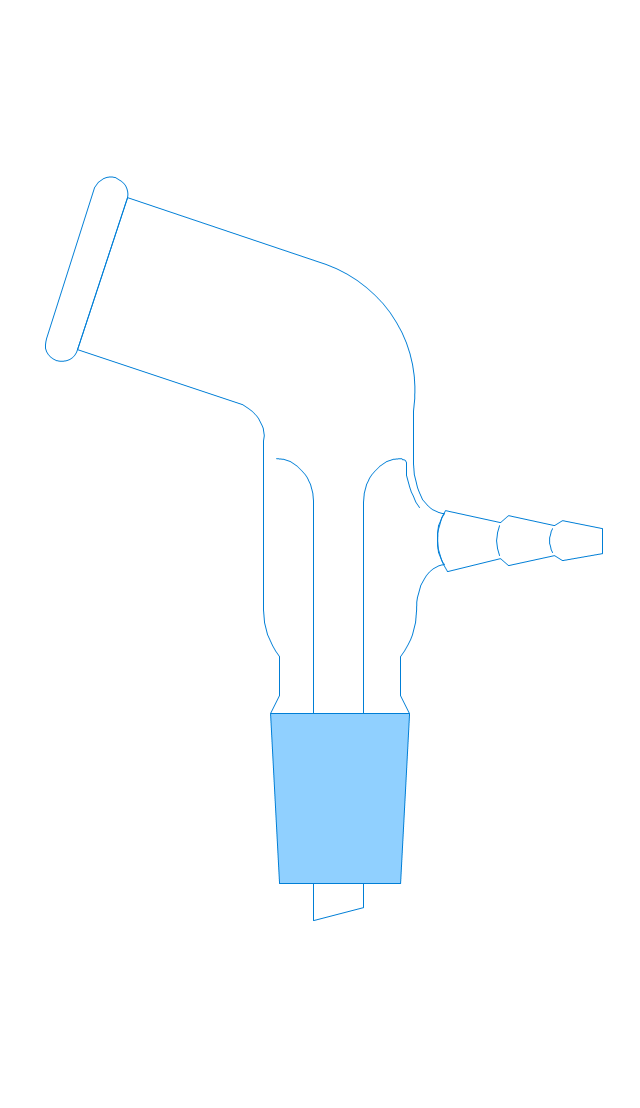
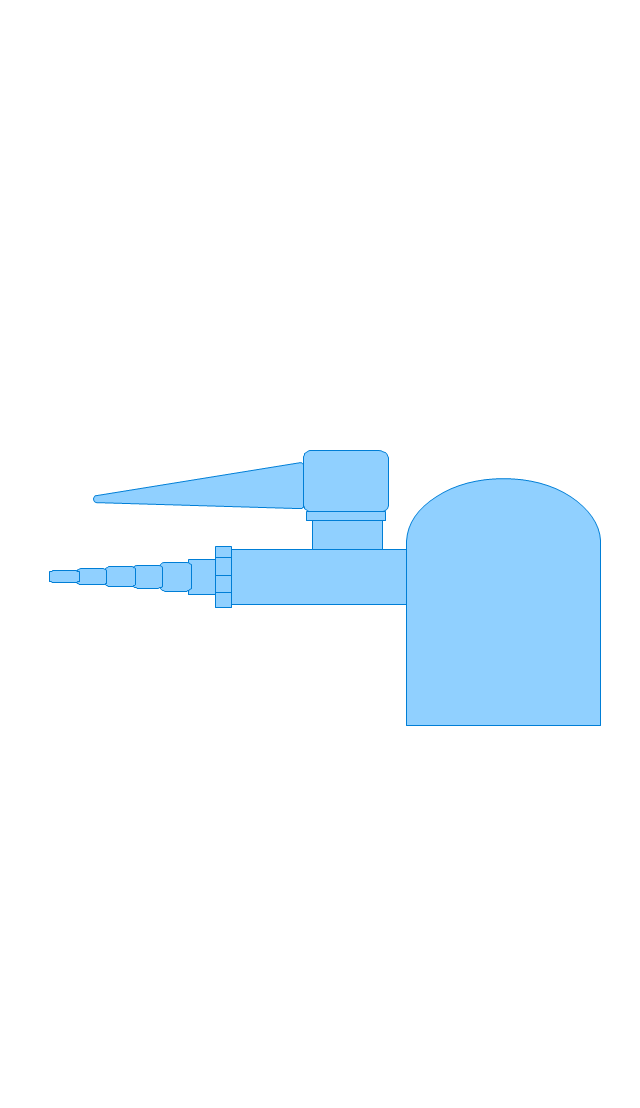
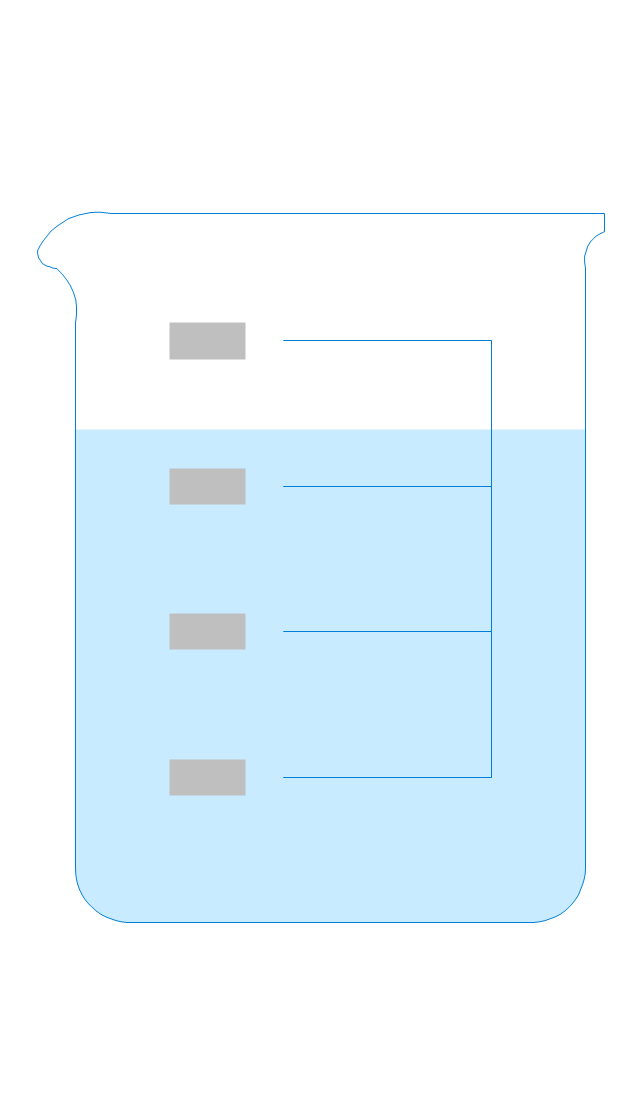
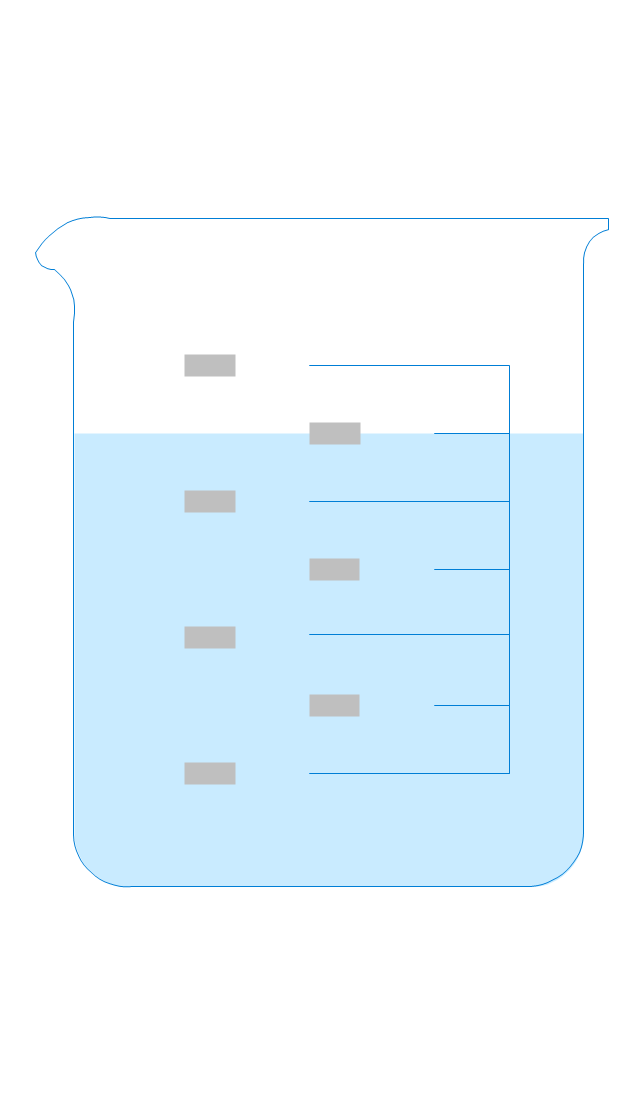
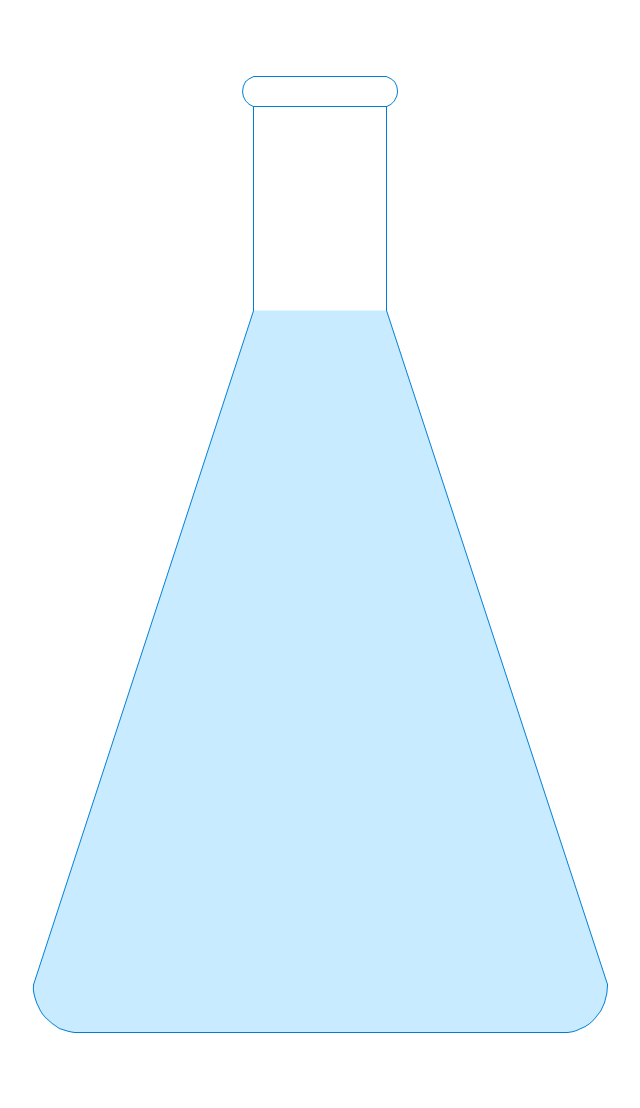
The vector stencils library "Laboratory equipment" contains 31 clipart icons of chemical laboratory equipment and labware.
Use these shapes for drawing part assembly and mounting schemes of glassware apparatus in chemical experiment diagrams and illustrations in the ConceptDraw PRO diagramming and vector drawing software extended with the Chemistry solution from the Science and Education area of ConceptDraw Solution Park.
Use these shapes for drawing part assembly and mounting schemes of glassware apparatus in chemical experiment diagrams and illustrations in the ConceptDraw PRO diagramming and vector drawing software extended with the Chemistry solution from the Science and Education area of ConceptDraw Solution Park.
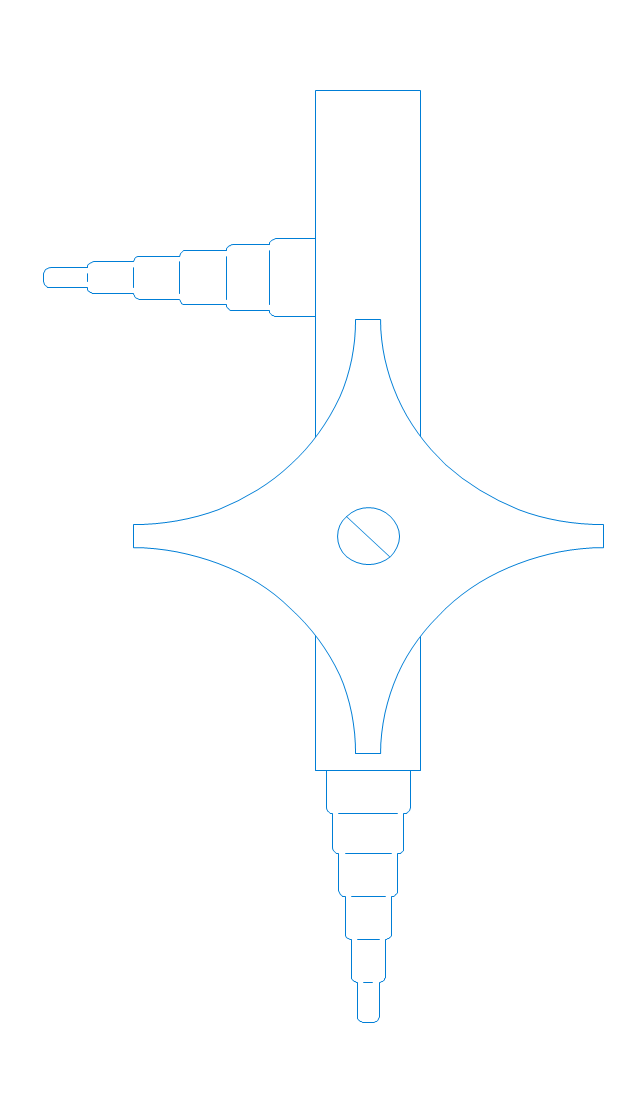
Vigreux distillation column
Hirsch funnel
Oil bath

Steam bath
Thermometer

Tap (valve)
--laboratory-equipment---vector-stencils-library.png--diagram-flowchart-example.png)
Vacuum adaptor
Liebig condenser (long)
-laboratory-equipment---vector-stencils-library.png--diagram-flowchart-example.png)
Liebig condenser (short)
-laboratory-equipment---vector-stencils-library.png--diagram-flowchart-example.png)
Water faucet
Büchner flask
Stemless funnel
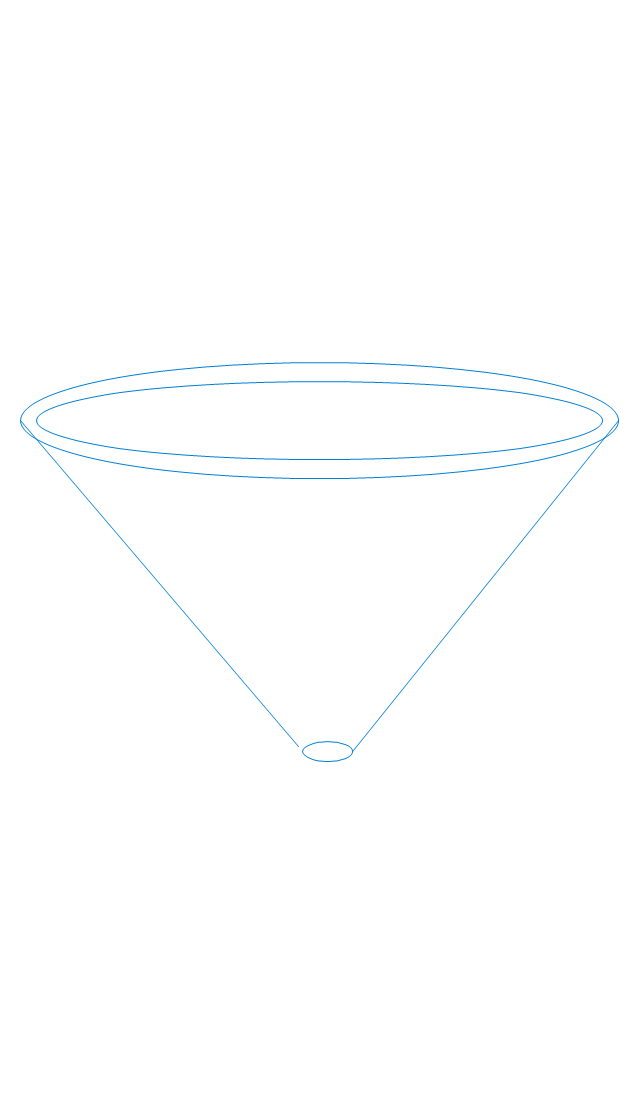
Stemmed funnel

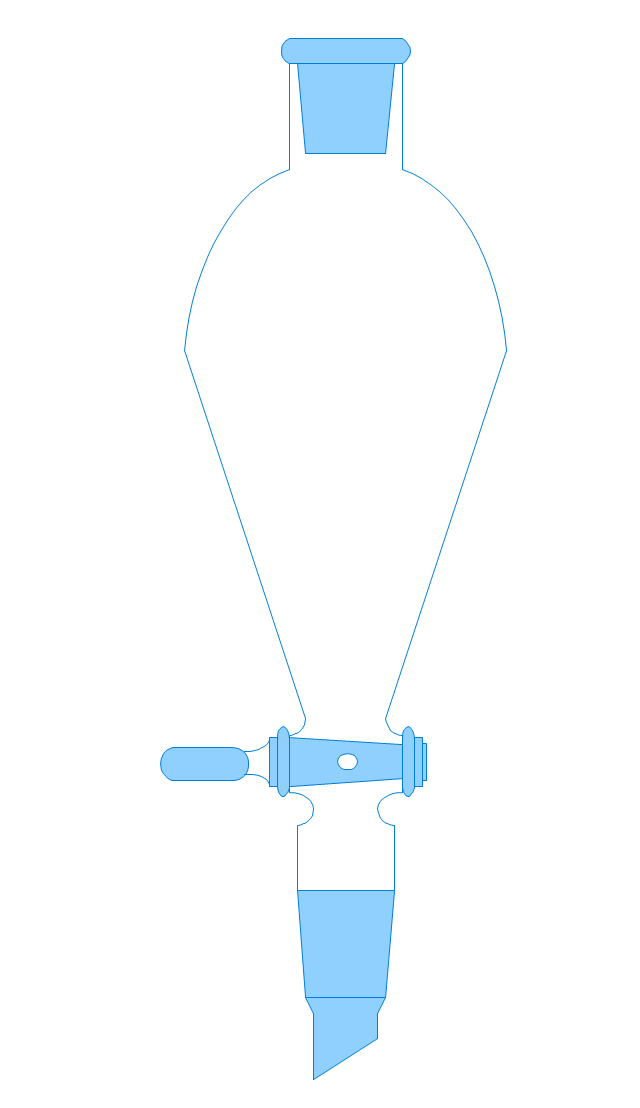
Separatory funnel
Heating mantle

Hot plate

Gas tap
Folded filter paper
Y-Adaptor
Claisen adapter

Bunsen burner

Büchner funnel

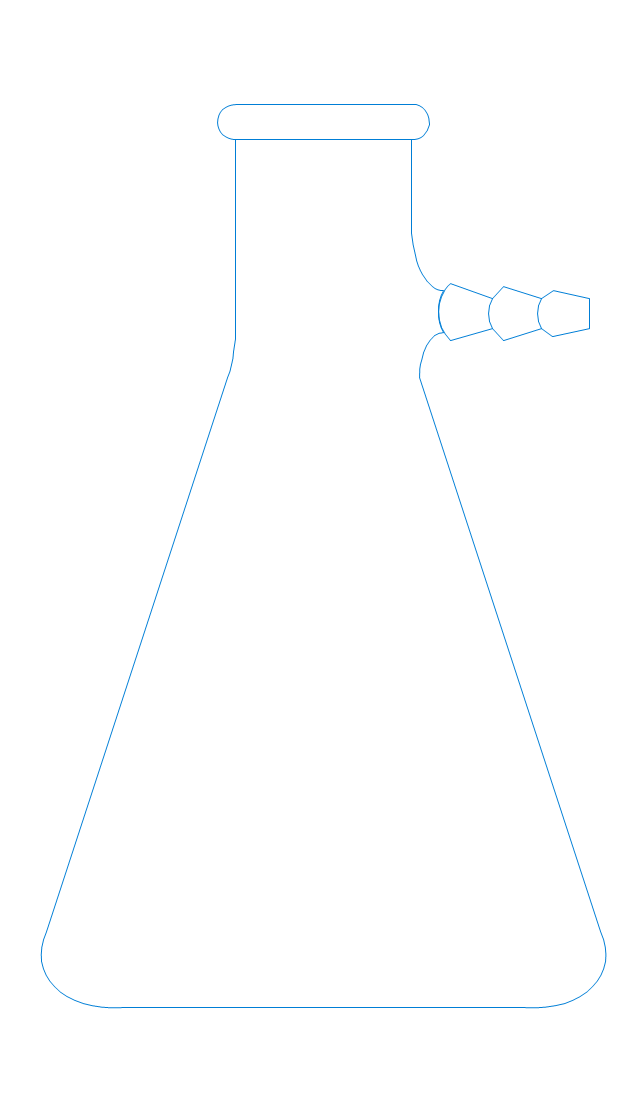
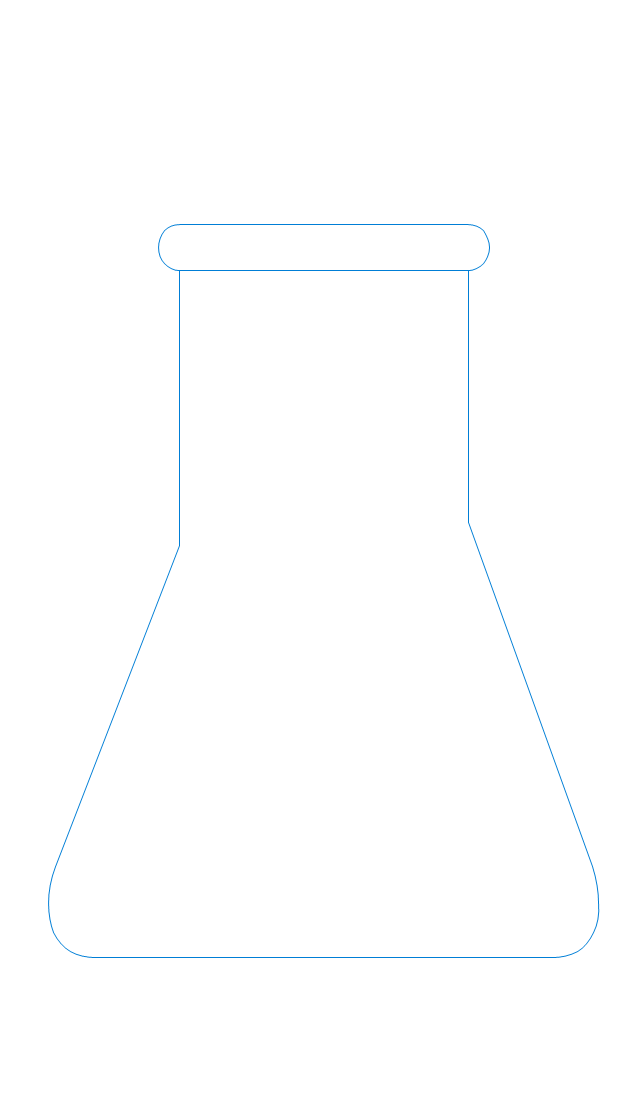
Erlenmeyer flask, 25ml
Round-bottom flask, 50ml

Round-bottom flask, 250ml

Beaker 100ml, filled
Beaker 100ml, empty

Beaker 500ml, filled
Beaker 500ml, empty

Erlenmeyer flask 250ml, filled
Erlenmeyer flask 250ml, empty

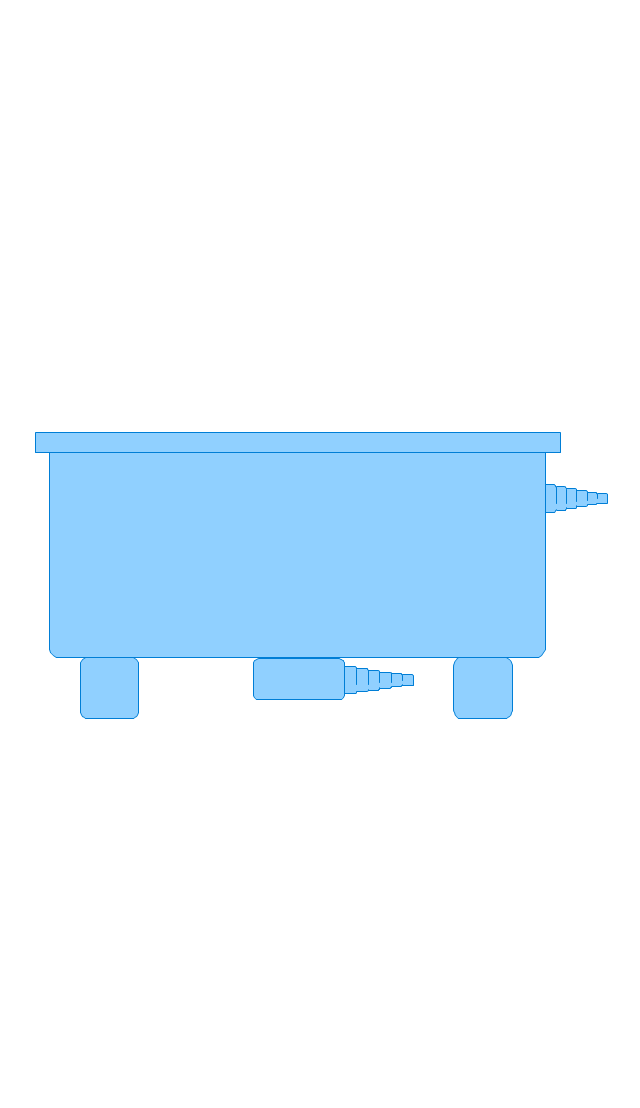
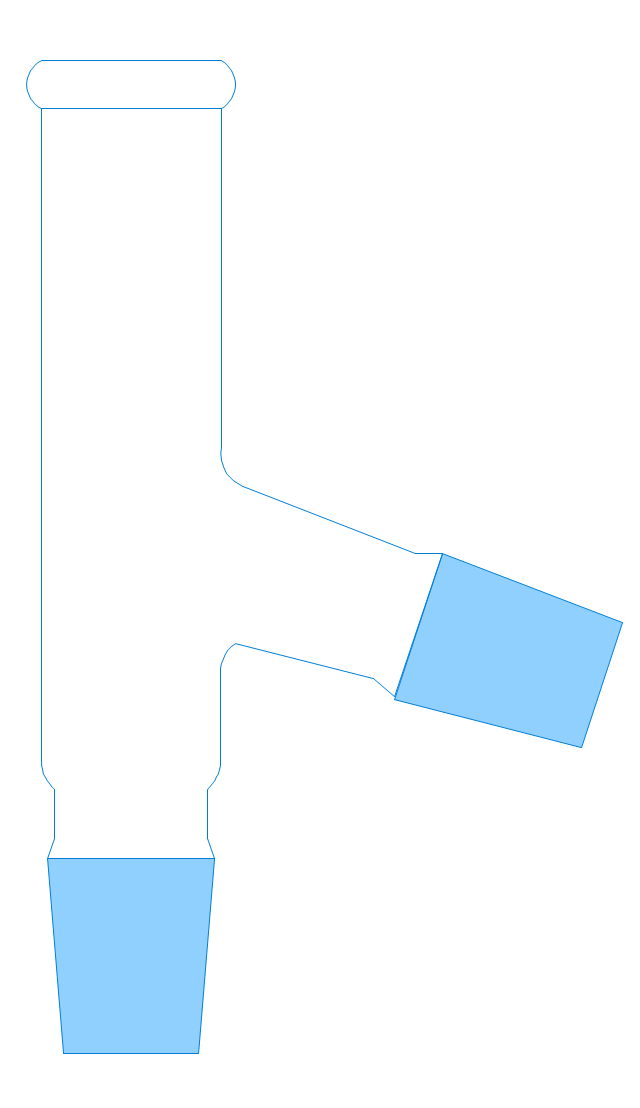
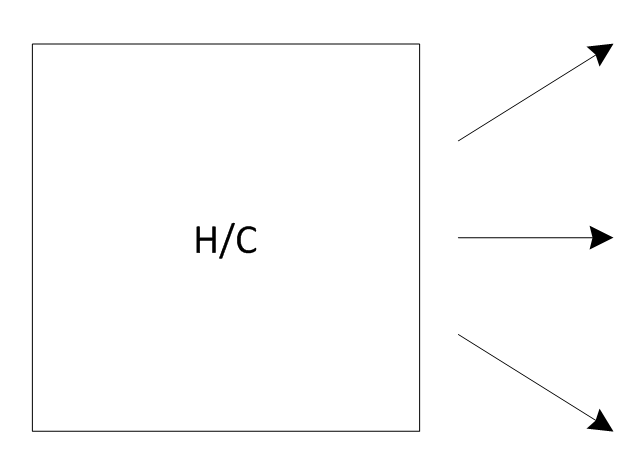
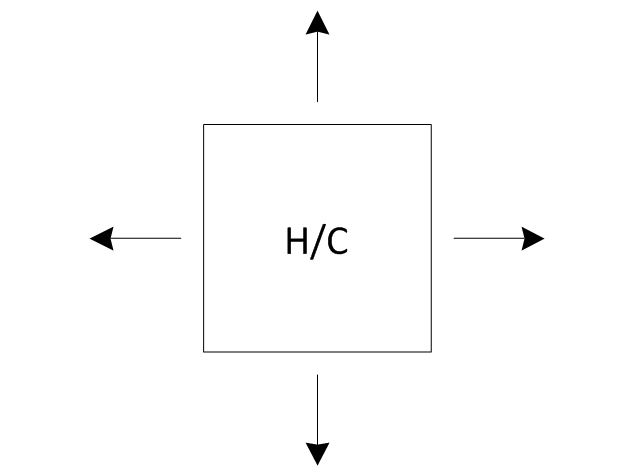
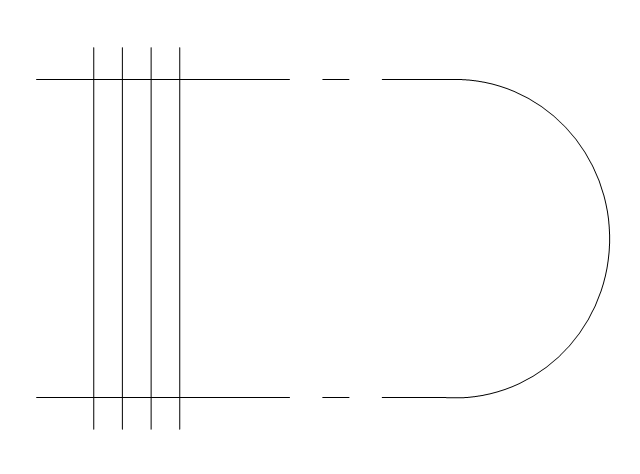
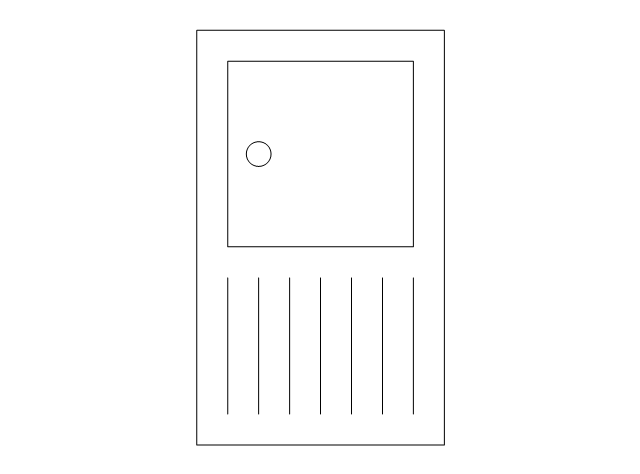
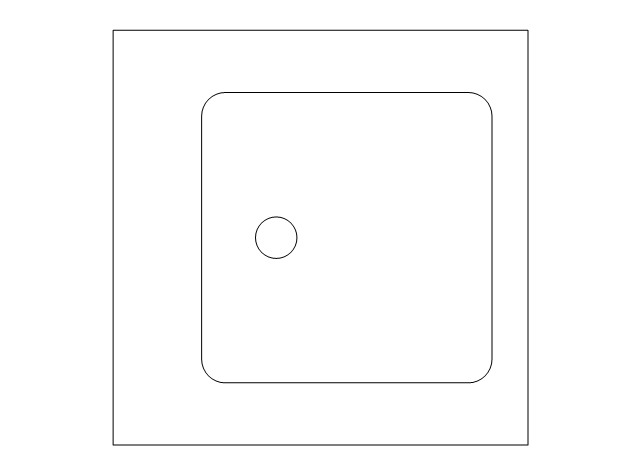
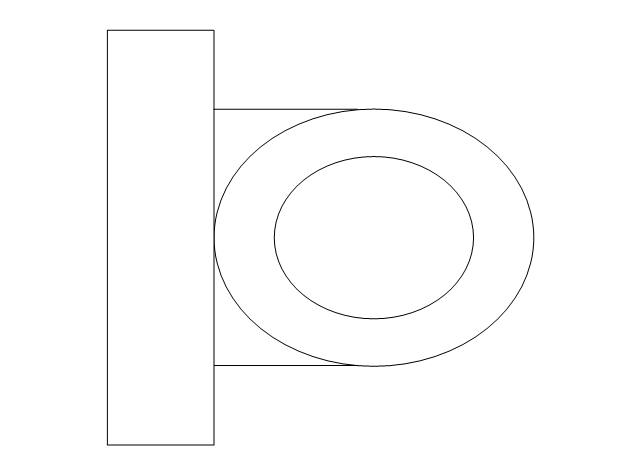
The vector stencils library "Plumbing" contains 31 symbols of plumbing components and bathroom fixtures. Use it for dawing plumbing and piping plans, schematic diagrams, blueprints of waste water disposal systems, hot and cold water supply systems in the ConceptDraw PRO diagramming and vector drawing software extended with the Plumbing and Piping Plans solution from the Building Plans area of ConceptDraw Solution Park.
Boiler, flat ends

Boiler, curved ends

Boiler, angled ends

Heating/Cooling coil

Pump
Pump

Radiator

Convector

Convector, fan
Radiant panel (plan), sgl
,-sgl-plumbing---vector-stencils-library.png--diagram-flowchart-example.png)
Radiant panel (plan), dbl
,-dbl-plumbing---vector-stencils-library.png--diagram-flowchart-example.png)
Heater/cooler, horizontal
Heater/cooler, downward
Radiant panel (face)
-plumbing---vector-stencils-library.png--diagram-flowchart-example.png)
Tank, open

Tank, closed

Water surface

Pipe coils

Pipe coils, fins
Pipe coils, break

Pipe coils, break, fins
Sink unit
Basin
Toilet
Bath

Basin (side)
-plumbing---vector-stencils-library.png--diagram-flowchart-example.png)
Toilet (side)
-plumbing---vector-stencils-library.png--diagram-flowchart-example.png)
Bath (side)
-plumbing---vector-stencils-library.png--diagram-flowchart-example.png)
End view

Washing machine
Shower head
Towel rail

Export from ConceptDraw DIAGRAM Document to a Graphic File


Amazon Web Services

- Water cycle diagram | Drawing a Nature Scene | Drawing Illustration ...
- Process Flowchart | Sketch Digram Of Water Cycle
- Digram Of Water Cycle
- Hydrological Cycle Flow Chart Diagram
- Water cycle diagram | Workflow diagram - Weather forecast | Bar ...
- Drawing a Nature Scene | Drawing Illustration | Water cycle diagram ...
- Scakech Of Water Cycle
- Hydrologic Cycle In A Schematic Diagram
- Download Easy And Beautiful Diagram Of Water Cycle
- Drawing Tools | Water Cycle For Kids Drawings
- Water cycle diagram | Drawing a Nature Scene | Draw Flowcharts ...
- Process Flow Chart | Skirtch Of Hydrological Cycle
- Circular Arrows | Water cycle diagram | Drawing a Nature Scene | A ...
- Digram Flow Chart Of Earth Movements
- Flow Sheet Diagram Of Water Cycle
- How To Draw A Water Cycle Diagram Step By Step
- Draw A Schematic And Diagramatic Representation Of Water Cycle
- Draw The Schematic Diagram Of Hydrology Cycle
- Draw The Diagram Of A Water Circle
- Drawing Illustration | Drawing a Nature Scene | Beauty in nature ...