Subway infographic design elements - software tools
Subway infographic design elements of MetroMap and ConceptDraw software tools.Spatial infographics Design Elements: Continental Map
ConceptDraw DIAGRAM is a software for making infographics illustrations. You can work with various components to build really impressive and easy-to-understand infographics design.Spatial infographics Design Elements: Location Map
Infographic Design Elements for visually present various geographically distributed information.Map Infographic Design
ConceptDraw collection of vector elements for infographics design.How to draw Metro Map style infographics? Moscow, New York, Los Angeles, London
The solution handles designs of any complexity, and the comprehensive library covers all key aspects of a transportation system. To further enhance your map design, there is the option to embed links, that can display station images or other relevant, important information. We have also included a set of samples in the solution, that show the possible real-world application — complex tube systems including the London Tube and New York City Subway show the level of detail possible when using the Metro Map Solution.Spatial infographics Design Elements: Transport Map
Do you like infographics and data visualization? Creating infographics is super-easy with ConceptDraw.Infographic design elements, software tools Subway and Metro style
Subway infographic design elements for ConceptDraw DIAGRAM (mac and pc).How To Make a Concept Map
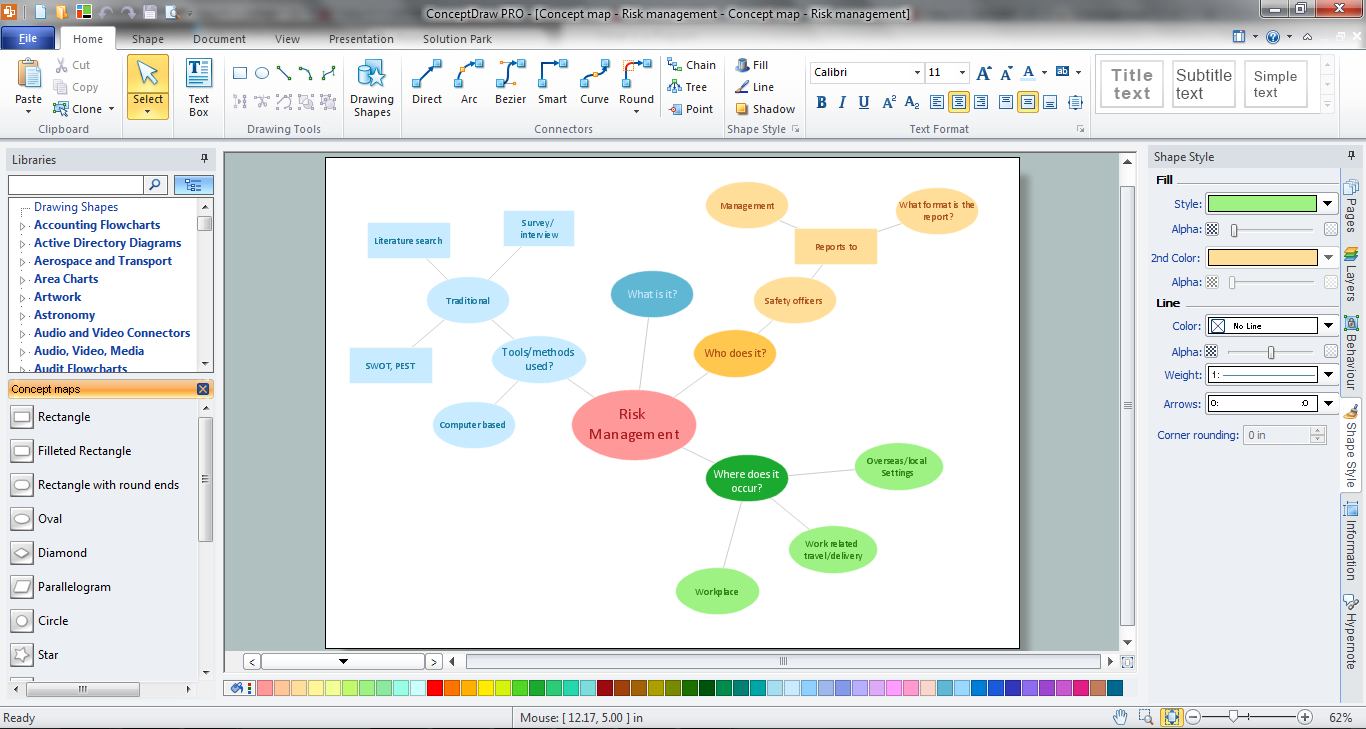
How to make a Concept Map fast and easy? ConceptDraw DIAGRAM diagramming and vector drawing software extended with Concept Maps Solution from the "Diagrams" Area is the best choice for those who want design professional looking Concept Map in minutes.Fire Exit Plan. Building Plan Examples
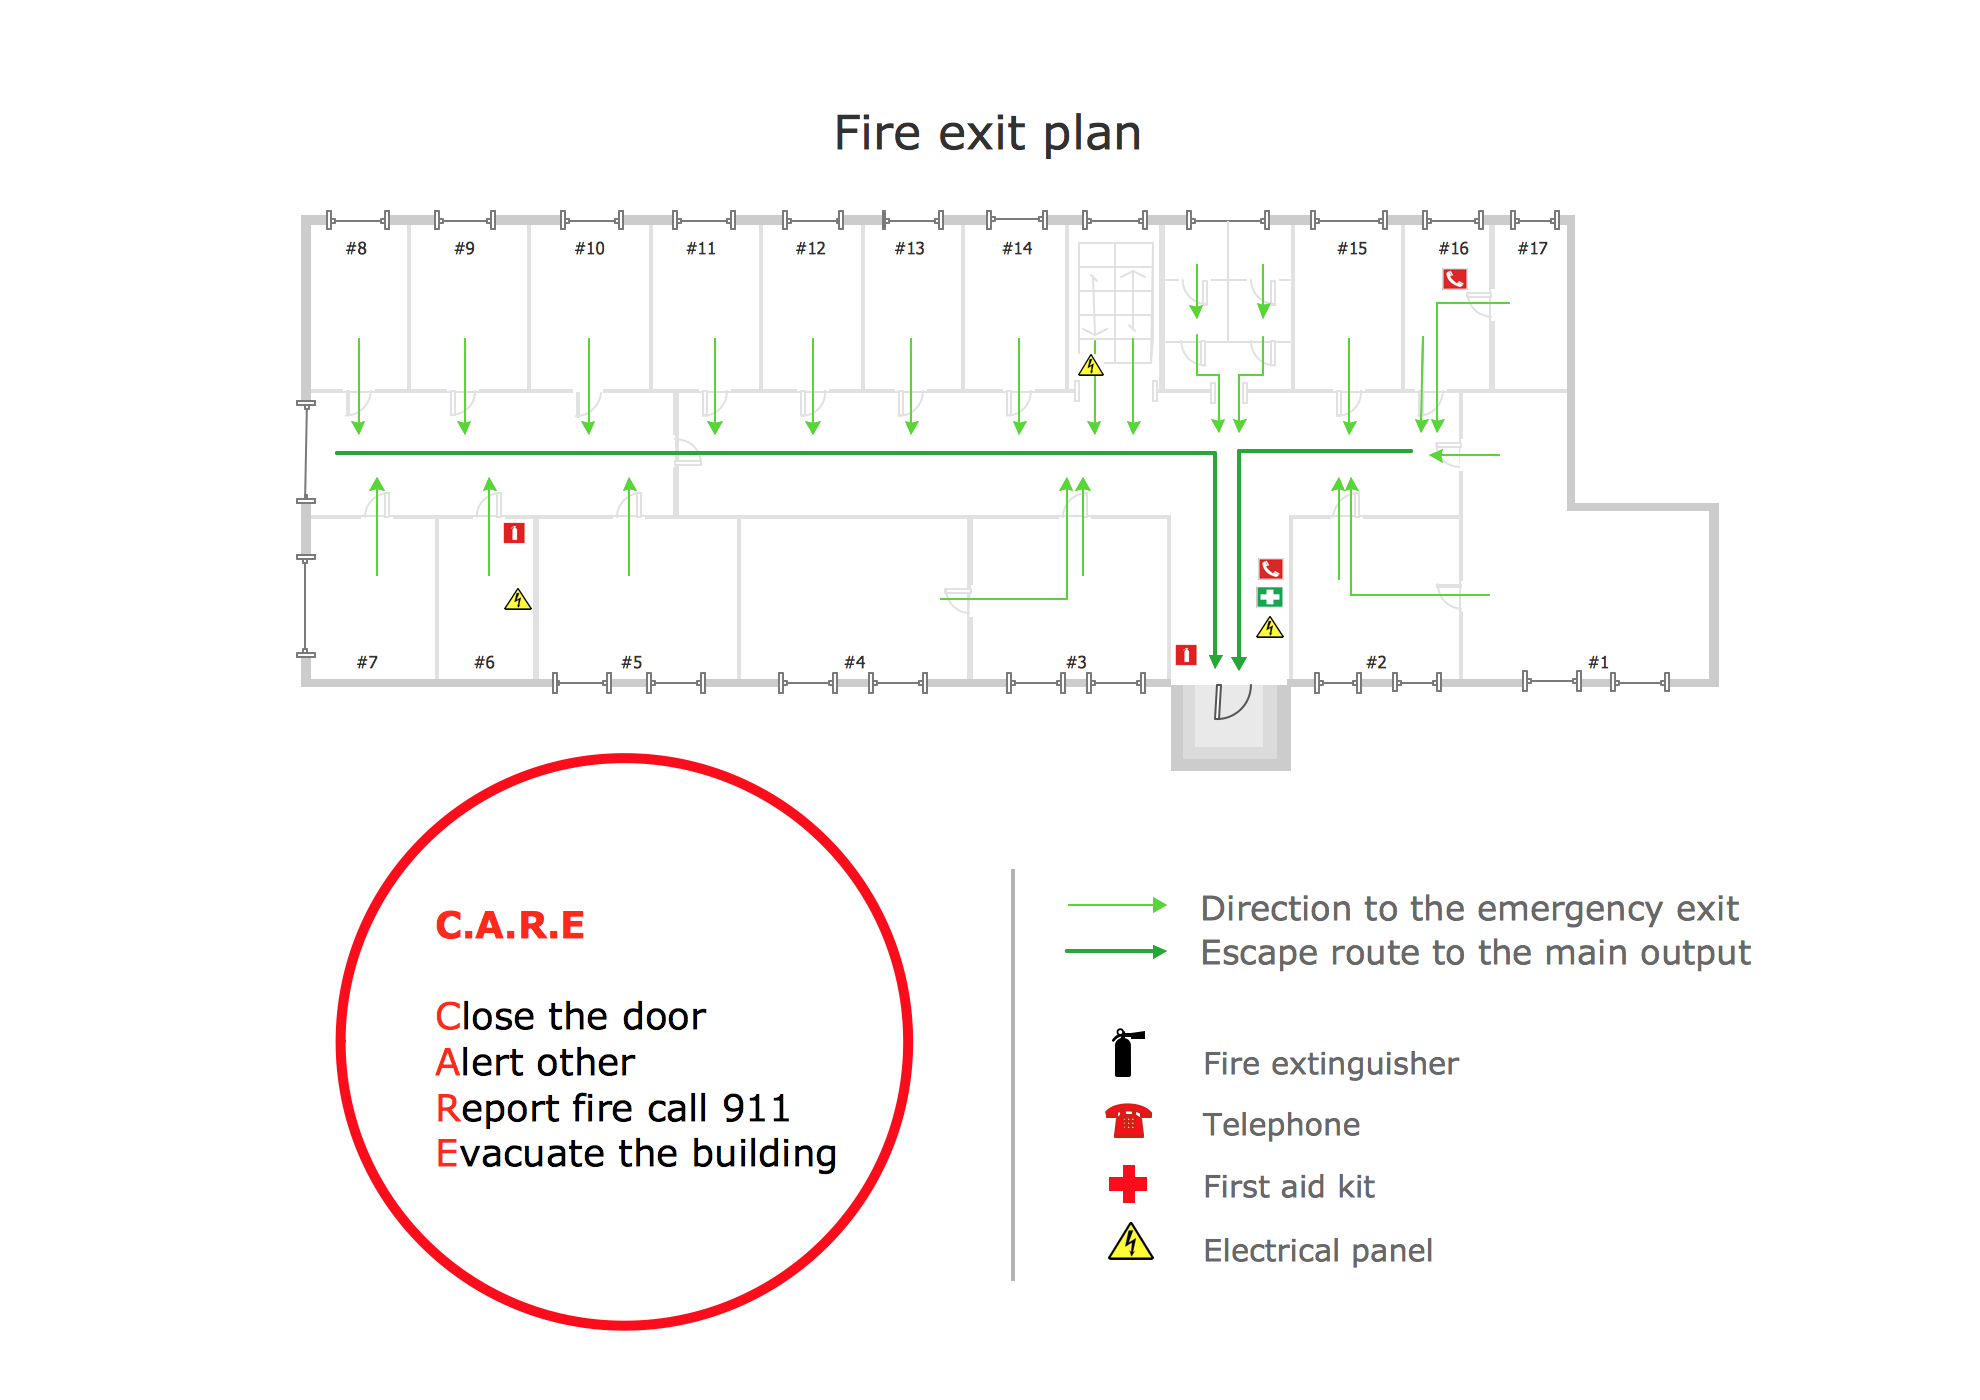
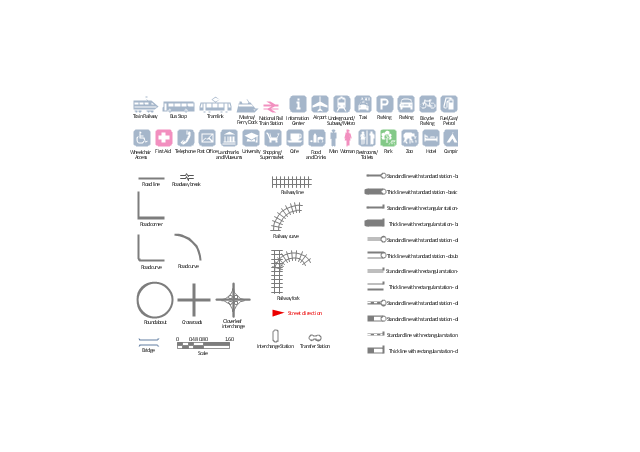
Fire exit plan or Emergency exit plan is an obligatory scheme for schools, universities, hospitals, hotels, business centers, metro, airports, and a lot of other buildings, public and private institutions. Fire exit plan depicts detailed plan of the building with marked emergency exits on it and helps to implement faster evacuation in various emergencies such as a fire. If a regular exit is blocked by fire, the plan helps to find the alternative exits, on the route to which are placed the signs leading to it. Fire and Emergency Plans solution from the Building Plans area of ConceptDraw Solution Park provides examples and samples, Fire and Emergency Plan quick-start template and vector stencils library with fire-fighting equipment design elements for drawing different types of emergency and fire schemes and plans: Evacuation plans, Fire Exit plans, Home Emergency plans, School Emergency plans, Office Emergency plans, Fire Emergency plans, Fire Evacuation plans, Fire Safety diagrams, Business Emergency plans, etc.The vector stencils library "Transport map" contains 96 signs and pictograms for drawing road and transit maps.
"A transit map is a topological map in the form of a schematic diagram used to illustrate the routes and stations within a public transport system - whether this be bus lines, tramways, rapid transit, commuter rail or ferry routes. The main components are color coded lines to indicate each line or service, with named icons to indicate stations or stops.
Transit maps can be found in the transit vehicles, at the platforms or in printed timetables. Their primary function is to help users to efficiently use the public transport system, including which stations function as interchange between lines. Unlike conventional maps, transit maps are usually not geographically accurate - instead they use straight lines and fixed angles, and often illustrate a fixed distance between stations, compressing those in the outer area of the system and expanding those close to the center." [Transit map. Wikipedia]
The pictograms example "Design elements - Transport map" was created using the ConceptDraw PRO diagramming and vector drawing software extended with the Spatial Infographics solution from the Maps area of ConceptDraw Solution Park.
The vector stencils library "Education maps" contains 44 map contours: the Group of Twenty (G20) state maps, EU state maps and world map.
Use it to visualize geospatial information on thematic maps in your education infograms.
"A world map is a map of most or all of the surface of the Earth. ...
A thematic map shows geographic information about one or a few focused subjects." [World map. Wikipedia]
The political World map example "Design elements - Education maps (World map)" was created using the ConceptDraw PRO diagramming and vector drawing software extended with the Education Infographics solition from the area "Business Infographics" in ConceptDraw Solution Park.
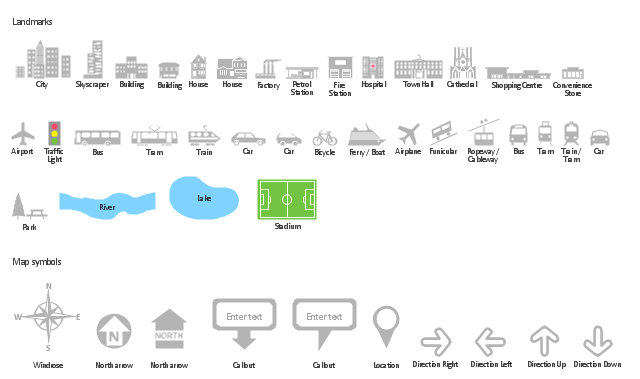
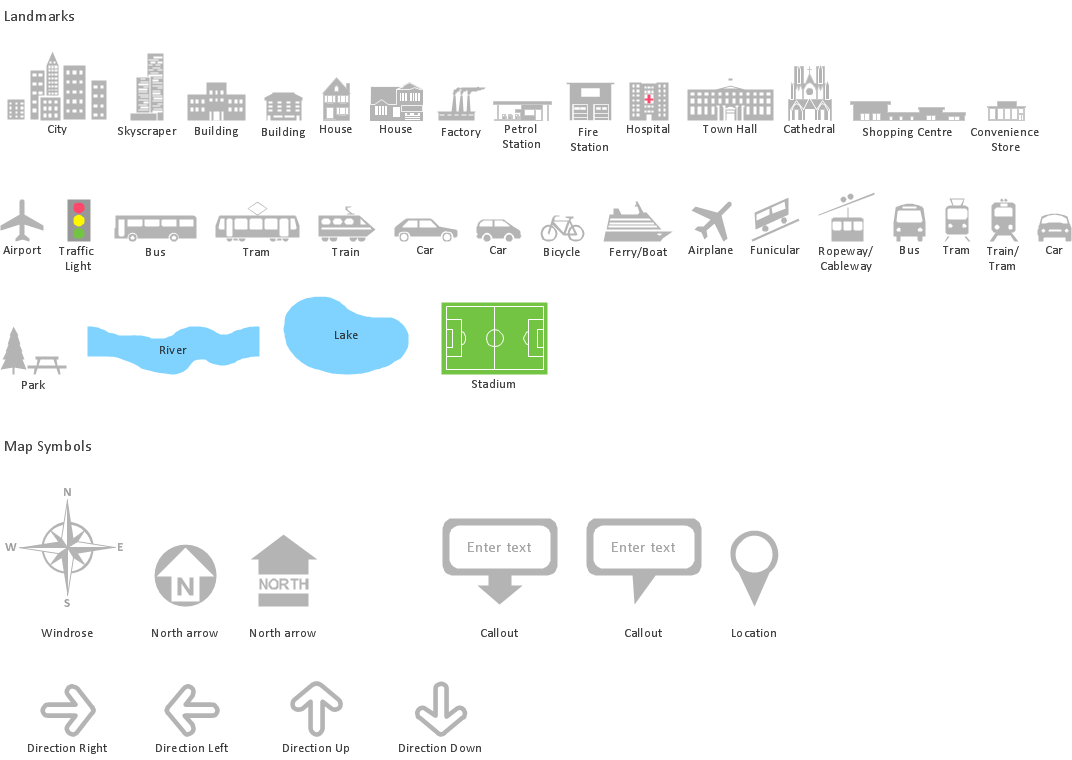
The vector stencils library "Landmarks" contains 34 signs and pictograms for drawing road and transit maps.
The vector stencils library "Map symbols" contains 10 signs and pictograms for drawing road and transit maps.
"A landmark is a recognizable natural or man-made feature used for navigation, a feature that stands out from its near environment and is often visible from long distances.
In modern use, the term can also be applied to smaller structures or features, that have become local or national symbols." [Landmark. Wikipedia]
The pictograms example "Design elements - Location map" was created using the ConceptDraw PRO diagramming and vector drawing software extended with the Spatial Infographics solution from the Maps area of ConceptDraw Solution Park.
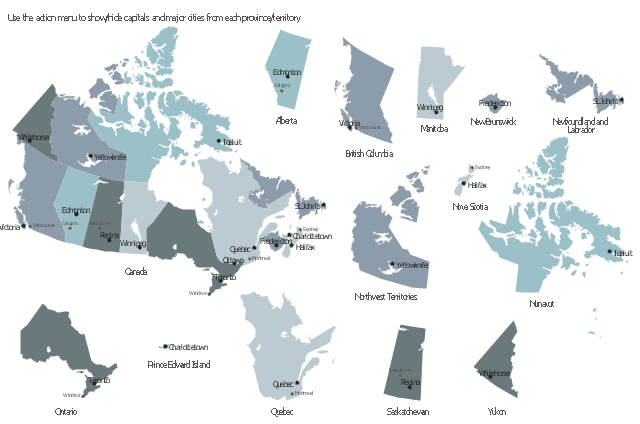
This sample displays state map contours with capitals and major cities of Canada provinces and territories. Use it to design your management infographics.
"The provinces and territories of Canada combine to make up the world's second-largest country by area. ... The ten provinces are Alberta, British Columbia, Manitoba, New Brunswick, Newfoundland and Labrador, Nova Scotia, Ontario, Prince Edward Island, Quebec, and Saskatchewan. The three territories are Northwest Territories, Nunavut, and Yukon." [Canada. Wikipedia]
The infogram shapes example "Design elements - Management map Canada" was created using the ConceptDraw PRO diagramming and vector drawing software extended with the Management Infographics solition from the area "Business Infographics" in ConceptDraw Solution Park.
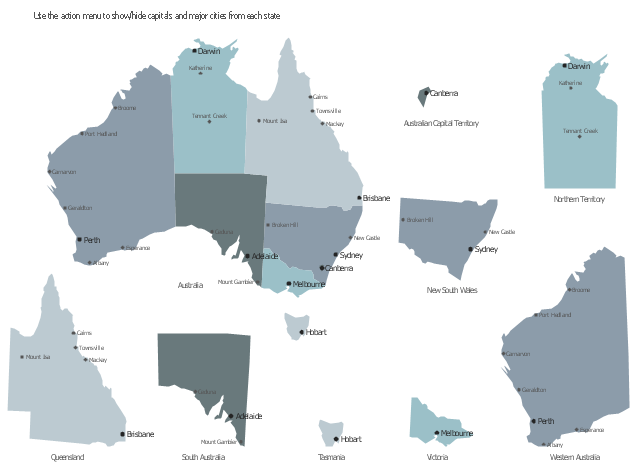
This sample displays map contours with capitals and main cities of Australia . Use it design your management infographics.
"The states and mainland territories of the Commonwealth of Australia combine to make up the world's sixth-largest country by total area. Australia comprises six states and various territories; the Australian mainland is made up of five states and three territories (including small, somewhat anomalous Jervis Bay Territory), with the sixth state being located on the island of Tasmania to the south of the mainland. In addition, there are six island territories, known as external territories. Australia also claims part of Antarctica as the Australian Antarctic Territory." [States and territories of Australia. Wikipedia]
The infogram shapes example "Design elements - Management map Australia" was created using the ConceptDraw PRO diagramming and vector drawing software extended with the Management Infographics solition from the area "Business Infographics" in ConceptDraw Solution Park.
- Directional Map Design Elements
- Map Infographic Creator | Spatial infographics Design Elements ...
- Conceptdraw.com: Mind Map Software, Drawing Tools | Project ...
- Design elements - Transport map | Subway Map | Subway Train ...
- Spatial infographics Design Elements: Location Map | Map ...
- Asian Map Designs
- Vector Map of Germany | MTA Subway Map | Value Stream Mapping ...
- Spatial infographics Design Elements: Continental Map | Brilliant ...
- Map Infographic Maker | Map Infographic Design | Map Infographic ...
- Spatial infographics Design Elements: Transport Map ...
- Spatial infographics Design Elements: Location Map | Spatial ...
- Map Design
- Spatial infographics Design Elements: Continental Map ...
- Map Infographic Creator | Map Infographic Design | How to draw ...
- Spatial infographics Design Elements: Transport Map | Maps ...
- Design Map
- Spatial infographics Design Elements: Continental Map | How To ...
- Spatial infographics Design Elements: Continental Map | Map ...
- Spatial infographics Design Elements: Location Map | Design ...
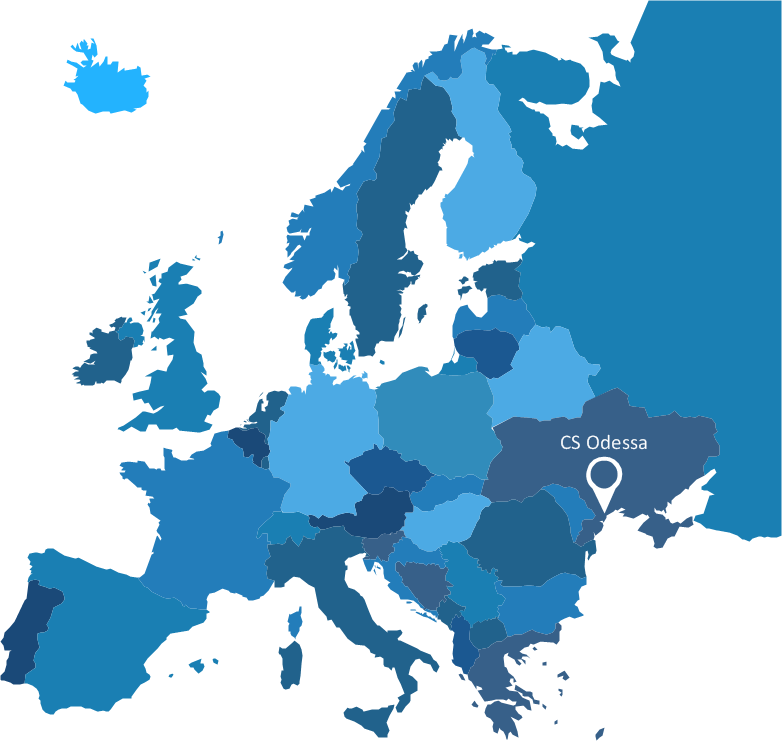
- Geo Map - Europe | Spatial infographics Design Elements ...




.png--diagram-flowchart-example.png)
