Tree Network Topology Diagram
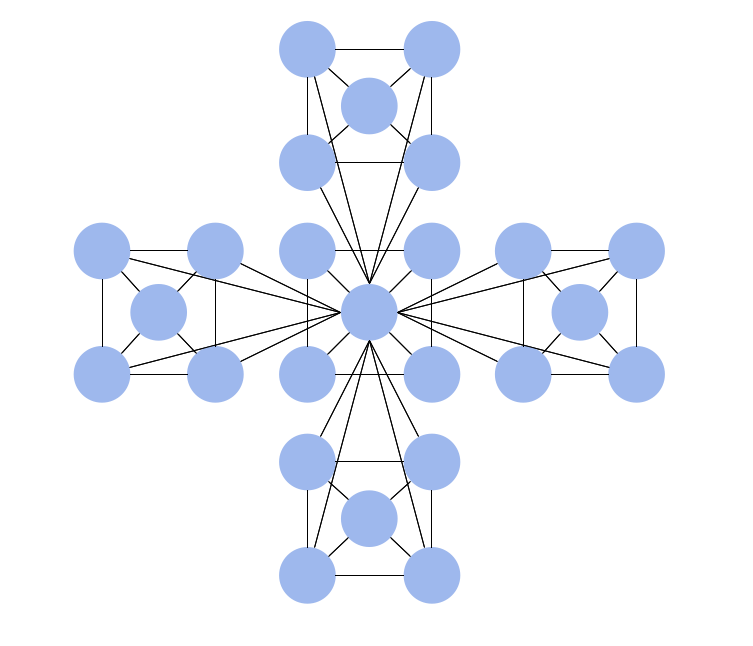
A Tree network topology (Hierarchical topology) is a hybrid network topology that contains the combination of two or more star networks connected via bus networks. Each star network is a LAN (local area network) with central computer or server and workstation nodes connected to it. The central computers of star networks are connected to a main cable that is called a bus. Each node of the Tree network can have an arbitrary number of child nodes, you can easy add/remove the separate workstations and even the whole star networks, the failure of one workstation will not affect the work of others. This topology is ideal solution when workstations are located in groups within a small physical region, rarely is used in WAN configurations. Computer and Networks solution from Computer and Networks area of ConceptDraw Solution Park contains templates, samples and numerous libraries of predesigned vector stencils of computer network devices and equipment, which can be effectively used for designing various network topologies diagrams, including Tree Network Topology.Hierarchical Network Topology
This sample was created in ConceptDraw DIAGRAM diagramming and vector drawing software using the Computer and Networks solution from Computer and Networks area of ConceptDraw Solution Park. This sample shows the Hierarchical network topology. A Hierarchical network topology interconnects multiple groups that are located on the separate layers to form a larger network. Each layer concentrates on the specified functions, this allows to choose the right equipment for the layer.Bus Network Topology
Bus Network Topology is a network topology that represents one shared cable (called a bus or backbone) to which are directly connected all workstations or computers of the network. At the ends of the cable are situated the terminators for prevention the signal reflection. All workstations at Bus Network Topology have equal rights and transfer the information sequentially, one after another. The message sent by one of workstations is extended on all computers of the network and each computer checks to whom it is addressed, if for him, then processes it. Addition of new subscribers to the "bus" is quite simple, the failures of individual computers are not dangerous, and the lack of a central subscriber even more increases its reliability. Computer and Networks solution included to Computer and Networks area of ConceptDraw Solution Park offers templates, samples and numerous vector stencils libraries that can be used to effectively design different physical and logical network topologies diagrams for wireless and wired computer networks, including Bus Network Topology.Gantt Chart Software
The Gantt Chart is the main interface in ConceptDraw PROJECT. It summarizes the tasks in your project and presents them graphically so you can easily view your progress.Hotel Network Topology Diagram
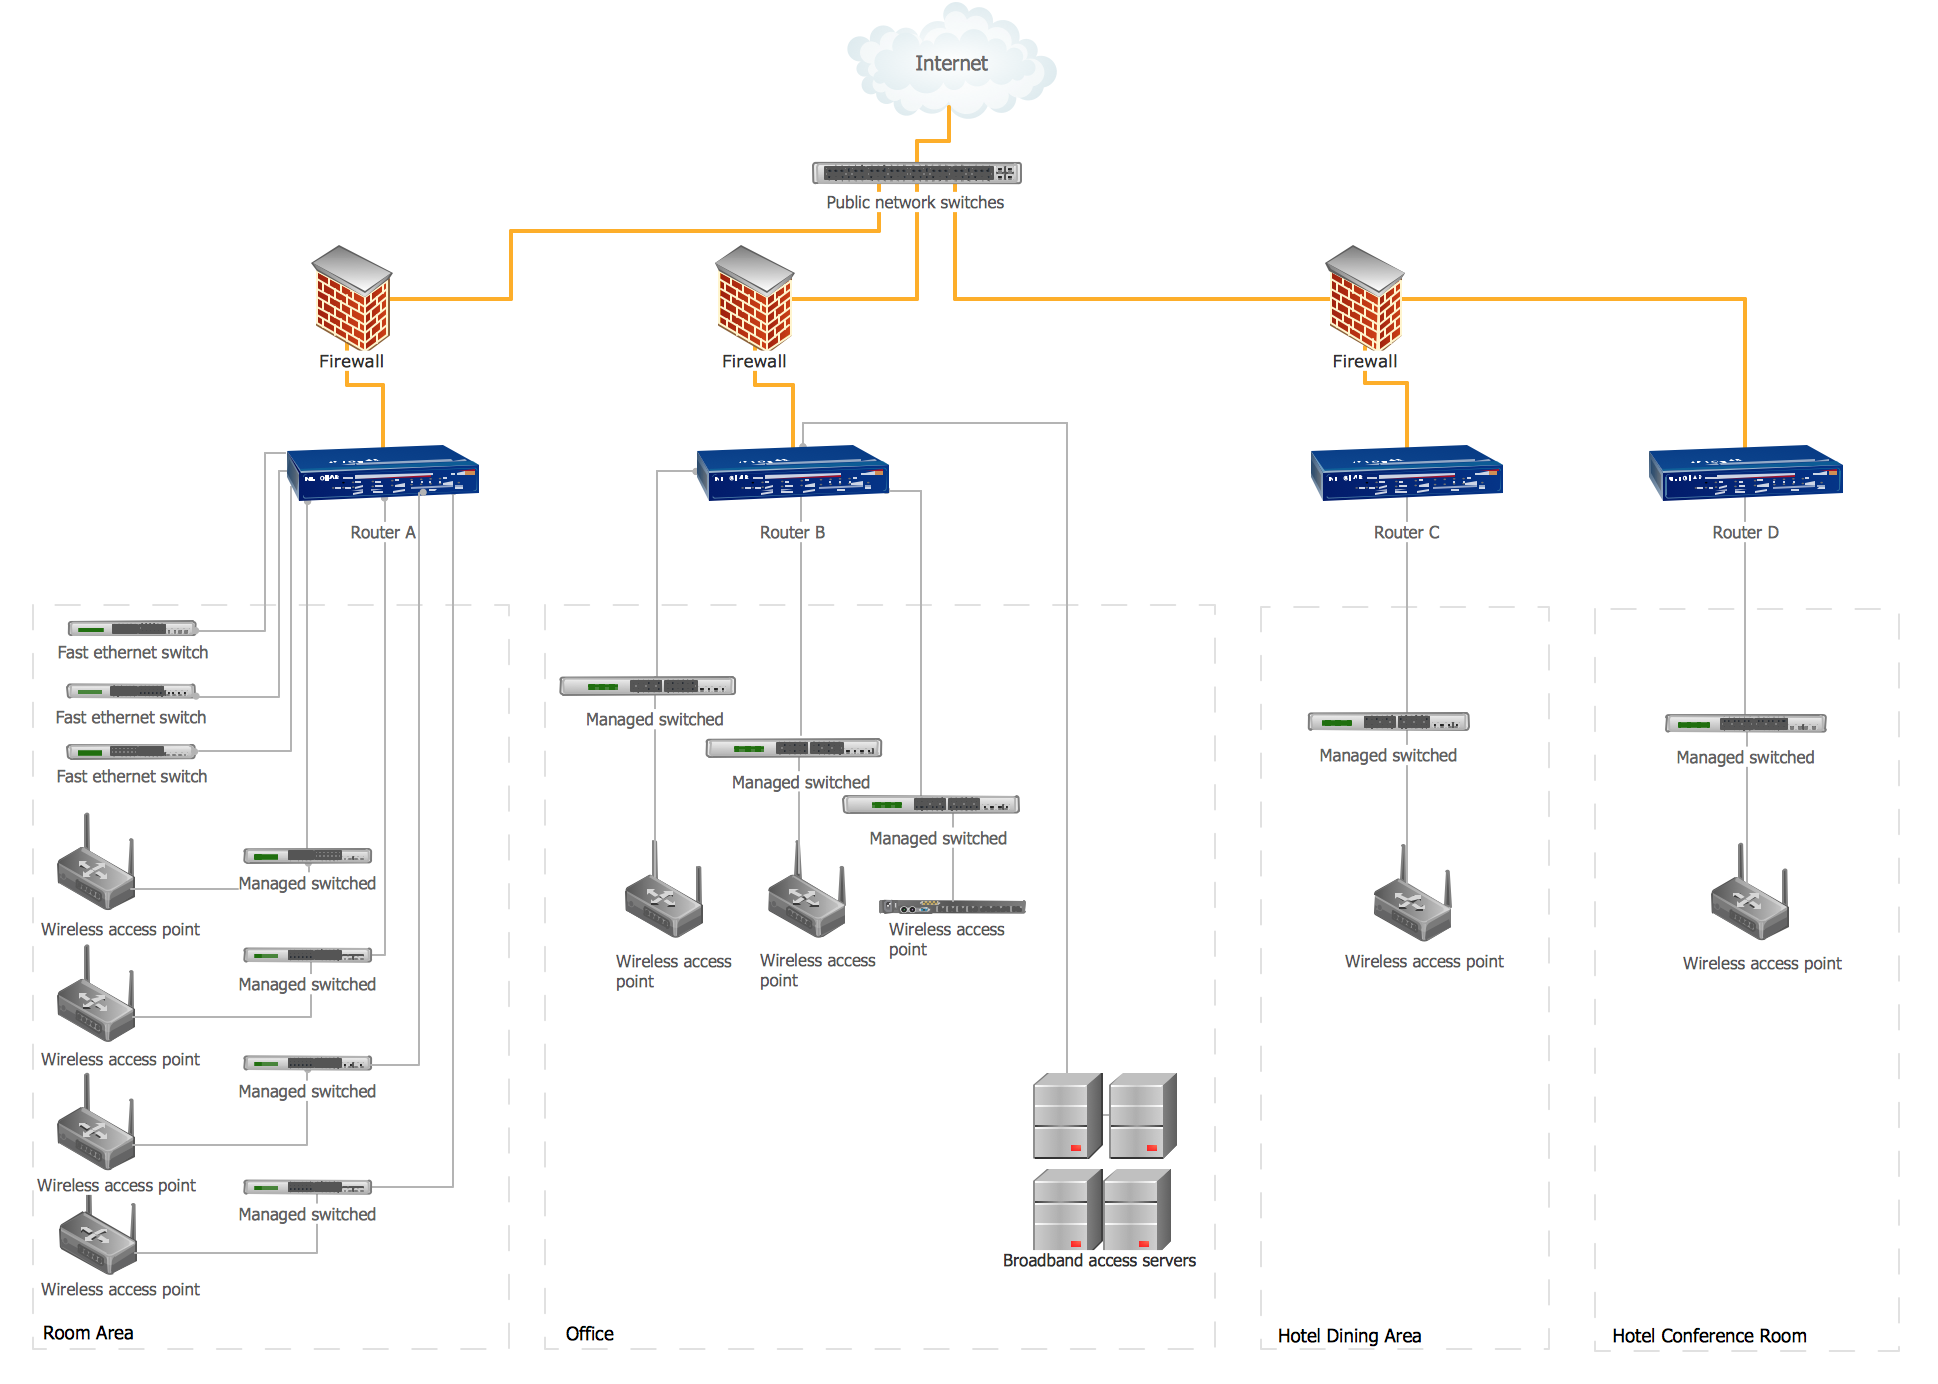
Network topology is a layout of various elements of computer network, such as nodes, links, routers, etc. It is a network topological structure which can be depicted logically or physically. Physical topology shows the physical location of network's components and cable connections between network nodes. Logical topology describes the data flows, the circulation of signals in physical topology. The physical and logical topologies for two networks can be identical, while their physical interconnections, the distances between nodes, transmission rates, and/or signal types may be differ. ConceptDraw DIAGRAM with Computer and Networks solution from Computer and Networks area of ConceptDraw Solution Park lets you design physical and logical network topology diagrams for wireless and wired computer communication networks located in various premises, including the hotels. You can easy design Hotel Network Topology Diagram, diagrams depicted LANs and WLANs, and also any of eight basic topologies (Point-to-point, Star, Bus, Mesh, Ring, Tree, Hybrid, Daisy chain).
Network Icon
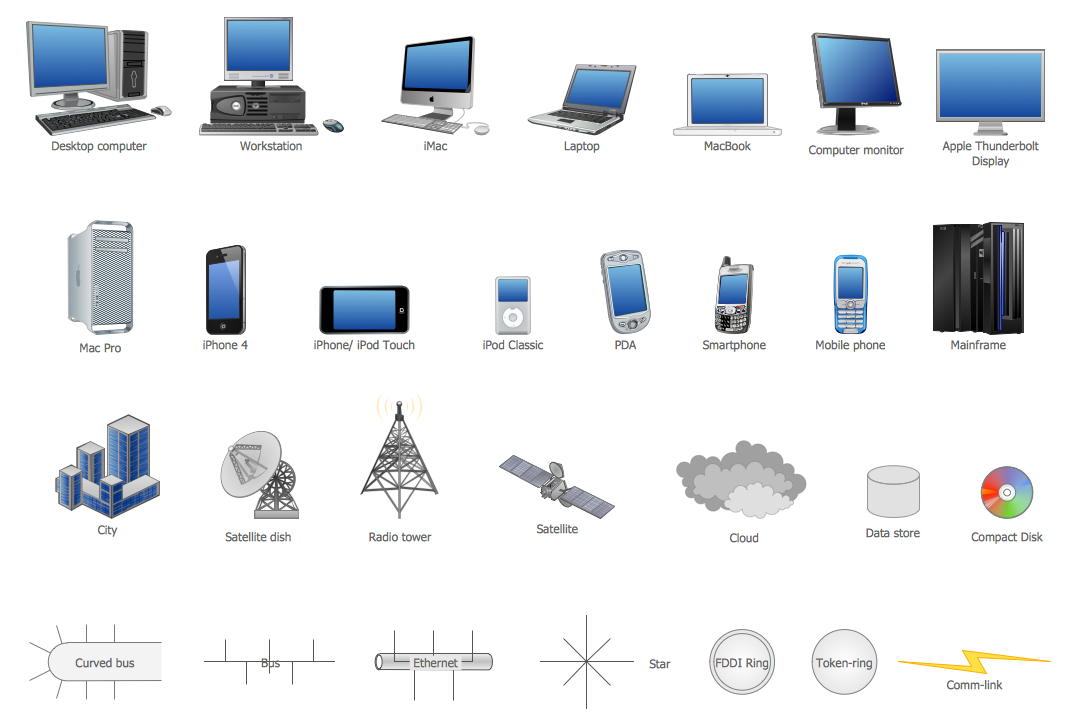
ConceptDraw DIAGRAM diagramming and vector drawing software extended with Computer Network Diagrams Solution from the Computer and Networks Area offers a set of useful tools, collection of templates, samples, and libraries of various computer symbols, computer devices icons, computer network icon for fast and easy drawing network computer diagrams and illustrations.Diagramming software for Amazon Web Service icon set: Monitoring, Deployment, Management
Monitoring Deployment Management icons - Amazon AWS pro diagrams - AWS diagrams are part of architecturing tools provided with ConceptDraw Solution Park.Wireless Network LAN
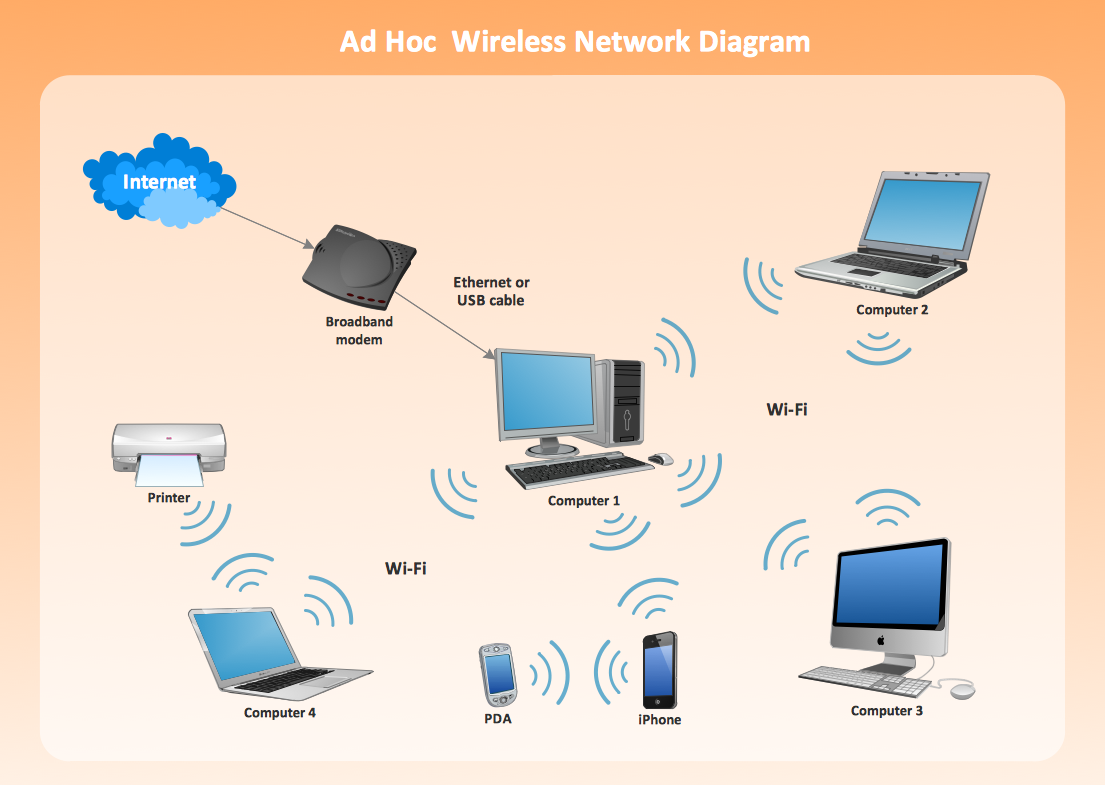
Wireless computer network diagrams help system administrators and network engineers to find out amount and type of equipment needed for each office LAN.ConceptDraw PROJECT Project Management Software Tool
ConceptDraw PROJECT is simple project management software. If you are on the fast track in your career and start facing such challenges as coordination many people, coordination tasks and works, manage project with a great deal of time and money involved - it is the right time to get Project management tool involved in your work.Design Element: Basic Network for Network Diagrams
ConceptDraw DIAGRAM is perfect for software designers and software developers who need to draw Basic Network Diagrams.
Flow Chart Symbols
The Flowcharts are incredibly useful and popular tool used in science, business, software development, analytics, engineering, marketing, manufacturing, administration, architecture, government, politics, and many other fields thanks to a variety of existing types of flowcharts. A Flowchart is a visual graphical representation of the process, algorithm, or the set of steps taken for problem's solution. Widely used for designing, visualizing and documenting simple and complex processes and programs, they effectively help to understand the process and to find easier the flaws if they are. Each flowchart type supposes the use of its own set of notations for drawing corresponding diagram, which includes the symbols of process, decision, data, document, data base, termination, initiation processes, processing loops, conditions, etc. It is easily design a Flowchart using the special professional flowchart maker - ConceptDraw DIAGRAM diagram software with numerous predesigned flow chart symbols grouped in libraries of Flowcharts solution from ConceptDraw Solution Park.Personal area (PAN) networks. Computer and Network Examples
Personal area network (PAN) is a network organized on a limited area and used for data transmission between various personal devices, such as computers, tablets, laptops, telephones, different digital and mobile devices, etc. and also for connecting to higher level network and Internet. PAN is used to manage the interconnections of IT devices which surround a single user and generally contains such appliances, as cordless mice, keyboard, phone, and Bluetooth handsets. PANs can be wired with computer buses, or wirelessly connected to the Internet using such network technologies as Bluetooth, Z-Wave, ZigBee, IrDa, UWB, Body Area Network. PANs have a lot of pros and cons, they are expedient, lucrative and handy, but sometimes have bad connection with other networks on the same radio bands, Bluetooth has distance limits and slow data transfer speed, but is comparatively safe. ConceptDraw DIAGRAM diagramming software supplied with numerous solutions of Computer and Networks Area included to ConceptDraw Solution Park perfectly suits for designing the Personal Area Networks.
Chemistry Drawing Software
ConceptDraw DIAGRAM extended with Chemistry solution from the Science and Education area is a powerful chemistry drawing software that provides the useful tools to help you design all kinds of chemistry drawings and illustrations, chemical schemes and diagrams of formulas, reaction schemes and lab set-ups of any complexity.Marketing Flow Chart
ConceptDraw DIAGRAM diagramming and vector drawing software extended with Marketing Diagrams Solution from the Marketing Area of ConceptDraw Solution Park is the best software for quick and easy creating Marketing Flow Chart of any complexity and design. This charts created to define marketing project stages. In small business project management it sometimes generated by simple marketing project management software. Here is samples which included in Marketing Area of ConceptDraw Solution Park and it can be used as for project planning software as for project management report.Basic CCTV System Diagram. CCTV Network Diagram Example
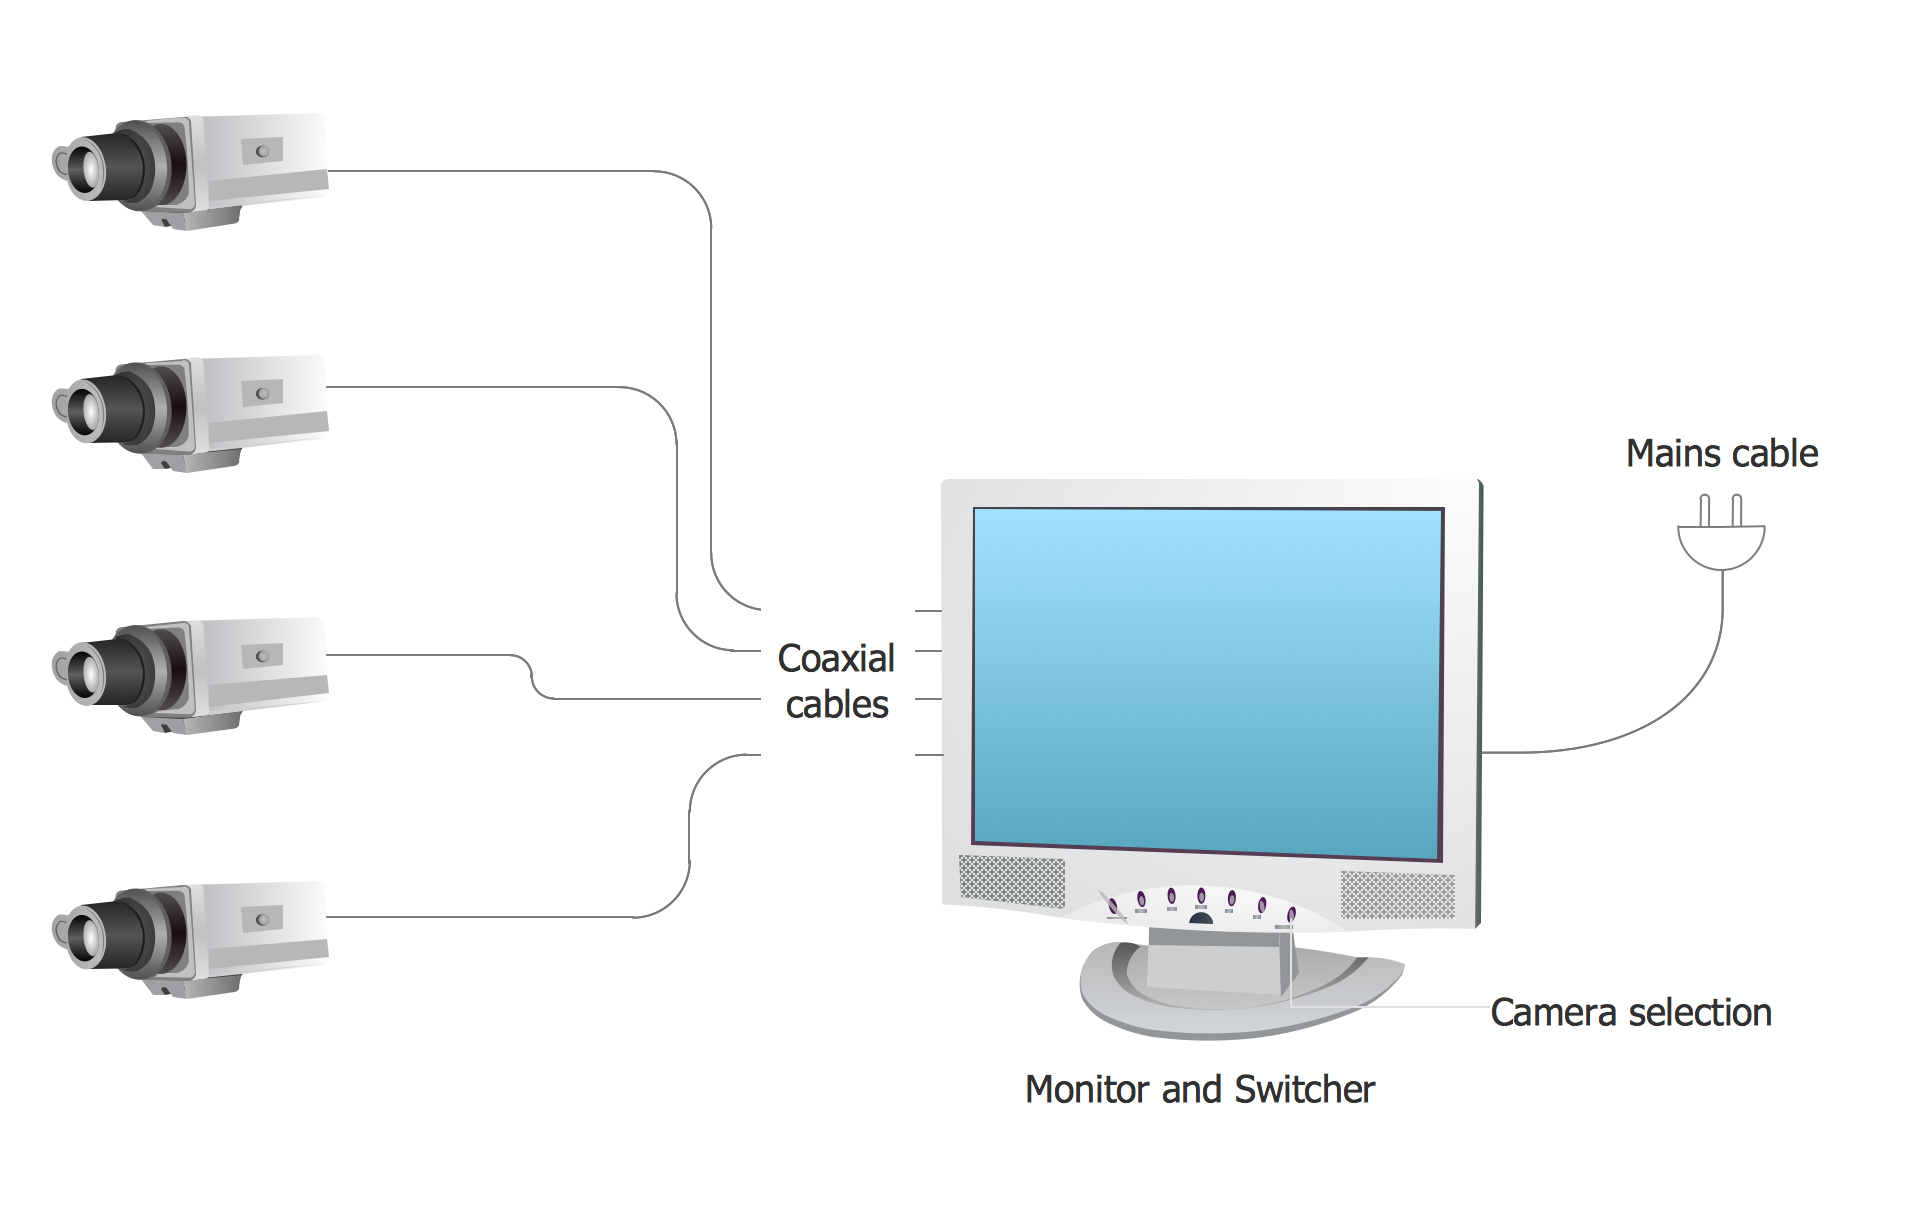
ConceptDraw DIAGRAM enhanced with Audio, Video, Media solution is a helpful tool for illustration of a CCTV network. It contains library of vector cliparts of video and TV devices and different digital gadgets for drawing such illustrationsWireless Network WAN
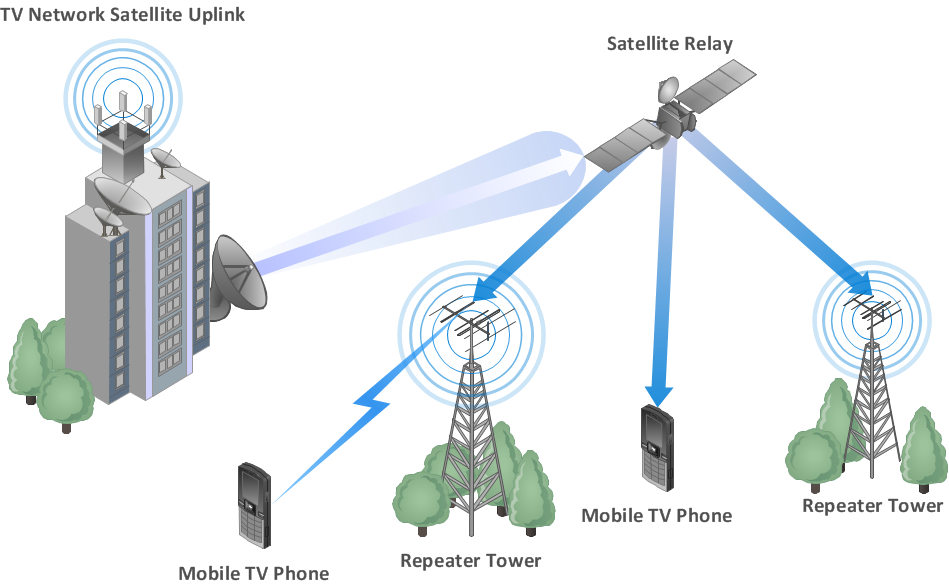
Wireless Networks solution from ConceptDraw Solution Park extends ConceptDraw DIAGRAM diagramming and vector drawing software to help network engineers and designers efficiently design, create and illustrate WAN network diagram of any complexity. The ConceptDraw DIAGRAM software helps users to quickly transit from an idea to the implementation of a Wireless Network WANCisco Routers. Cisco icons, shapes, stencils and symbols
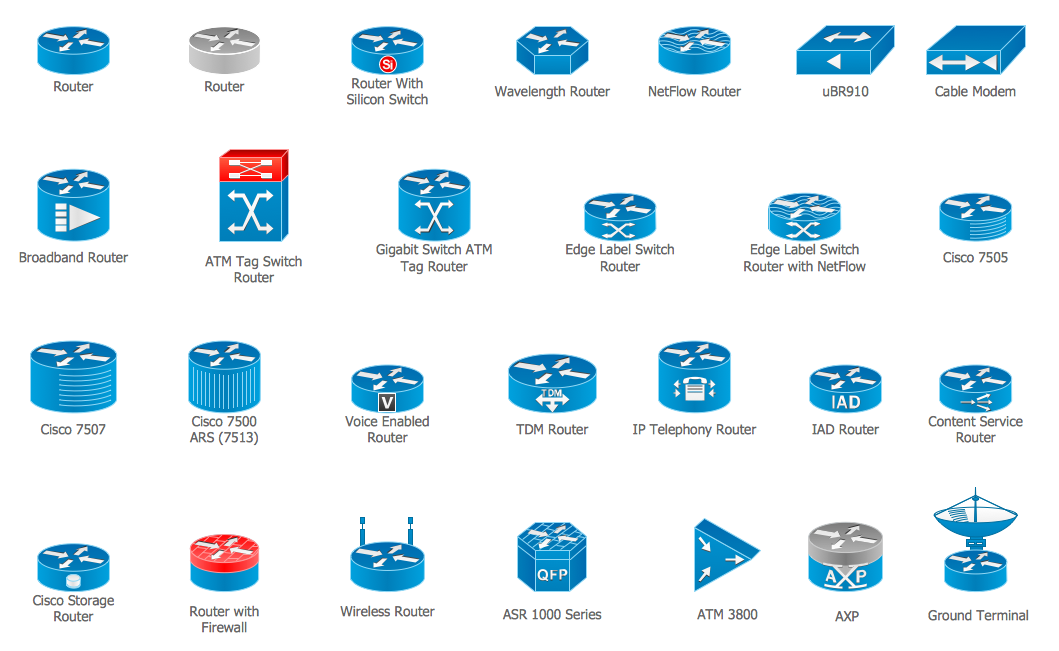
Network infrastructure planning is a very important process in the network construction, and the share of time allocated to this within the scope of the entire project may reach 60-80%. A competent and thorough approach to planning contributes to the quick investment return, and also increases the reliability and flexibility of the final system, reducing the probability of additional costs related to the incorrect implementation. Any planning begins with an analysis of the business requirements to the final system. Basic network parameters, which should be assessed are the scalability, accessibility, cost, speed and safety. Speed and cost are often mistaken for the most important parameters, and the rest of the parameters aren't even remembered. This is not entirely correct. Initially, it is necessary to assess the business plans for the future, because sometimes it is more profitable to invest more money in the beginning. If the business is to develop, then, consequently, demands onHow To create Value Stream Map (VSM)
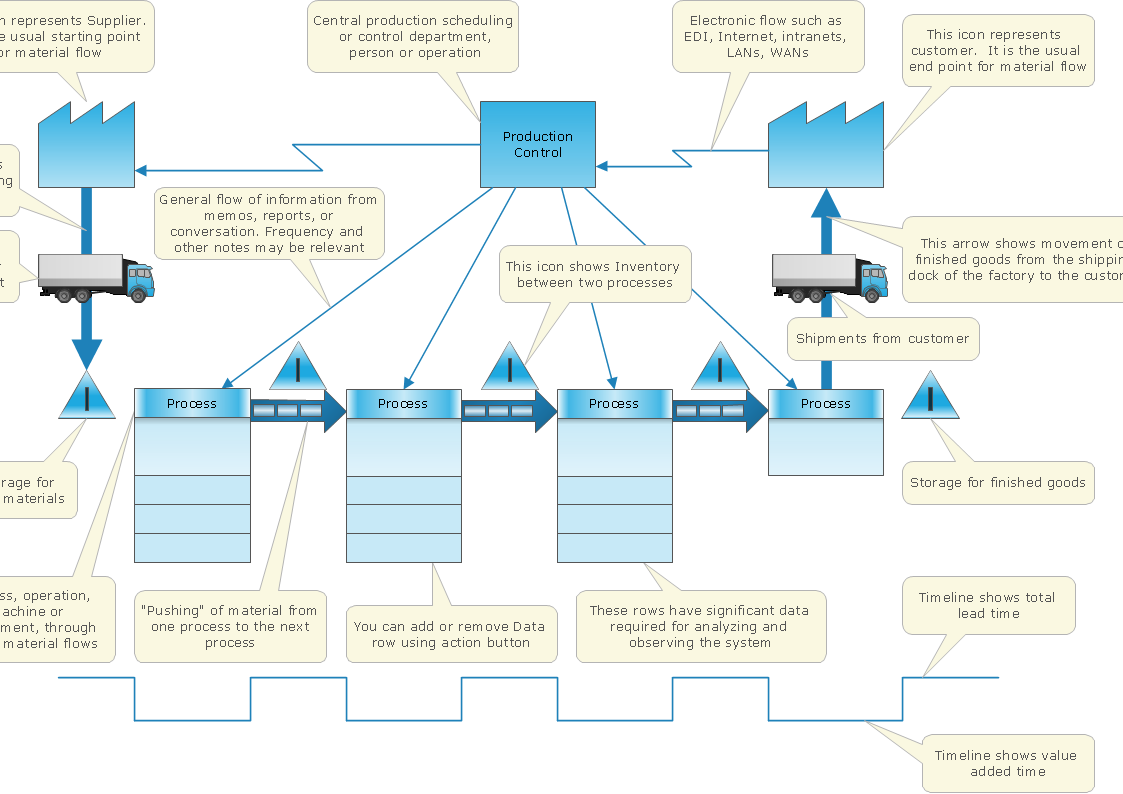
Value Stream Map template helps you to create VSM diagrams using ConceptDraw DIAGRAM software.Cross-Functional Flowchart (Swim Lanes)
Cross-Functional Flowchart is a type of chart which shows the series of process steps connected by the arrows to depict their order and applies the swim lanes to provide an extra dimension with means of assigning each process step to certain category. Often the category or the functional unit is a stakeholder (department, person, role), resource, project, phase, or any other attribute. Cross-Functional Flowcharts visually illustrate relationships between the business processes and the functional units responsible for this processes. ConceptDraw DIAGRAM is a powerful diagramming and vector drawing software for professional design Cross-Functional Flowcharts using the common notation of shapes and swim lanes. Cross-Functional Flowcharts solution included to the Business Processes area of ConceptDraw Solution Park provides numerous well-designed vector objects and connector tools for quick, easy and effective organizing information, representing process flows and relationships, and drawing Cross-Functional Flowcharts for business, science, education, technology, etc.- Categorys Of Project Topologies In Project Management
- Quality Project Management with Mind Maps | Network Topologies ...
- Project Topology In Project Management
- Quality Project Management with Mind Maps | How to Make a ...
- Activity on Node Network Diagramming Tool | Activity Network ...
- Topologies Of Projects Management
- Draw Project Management Nodes
- Project Management Area | Network Layout Floor Plans | Star ...
- Network Plan Project Management
- Planning a Trip with ConceptDraw Project | Ring Network Topology ...
- Diagrams Of Hotel Management System Project
- ConceptDraw PROJECT Project Management Software Tool | How ...
- Network Diagram Of Project Management Solutions
- Sample Of Project For Wan Network Desigen
- Project —Task Trees and Dependencies | Tree Topology
- Network Diagram In Project Management Examples
- Dairy Management System Project Diagram
- Computer Network. Computer and Network Examples | Wireless ...
- ConceptDraw PROJECT Project Management Software Tool | PM ...
- Draw Network Diagram based on Templates and Examples ...




.png)


