 Divided Bar Diagrams
Divided bar diagrams solution extends ConceptDraw PRO software with templates, samples and library of vector stencils for drawing the divided bar charts.
A Divided Bar graph is a rectangle divided into smaller rectangles along its length in proportion to the data. Segments in a Divided Bar represent a set of quantities according to the different proportions of the total amount.
The example "Divided bar graph - Global natural gas consumption (2010)" was drawn on the base of International Energy Statistics from the U.S. Energy Information Administration (EIA) website. [eia.gov/ cfapps/ ipdbproject/ IEDIndex3.cfm?tid=3&pid=26&aid=2]
"Natural gas is a fossil fuel formed when layers of buried plants and animals are exposed to intense heat and pressure over thousands of years. The energy that the plants originally obtained from the sun is stored in the form of chemical bonds in natural gas. Natural gas is a nonrenewable resource because it cannot be replenished on a human time frame. Natural gas is a hydrocarbon gas mixture consisting primarily of methane, but commonly includes varying amounts of other higher alkanes and even a lesser percentage of carbon dioxide, nitrogen, and hydrogen sulfide. Natural gas is an energy source often used for heating, cooking, and electricity generation. It is also used as fuel for vehicles and as a chemical feedstock in the manufacture of plastics and other commercially important organic chemicals." [Natural gas. Wikipedia]
The diagram example "Divided bar graph - Global natural gas consumption (2010)" was created using ConceptDraw PRO diagramming and vector drawing software extended with the Divided Bar Diagrams solution from the Graphs and Charts area of ConceptDraw Solution Park.
Divided bar chart
---divided-bar-graph.png--diagram-flowchart-example.png)
HelpDesk
How to Draw a Divided Bar Chart in ConceptDraw PRO

Stacked Graph

A divided bar chart is a rectangle divided into segments, illustrating numerical proportion. In a divided bar chart, the length of each segment (and consequently its area), is proportional to the quantity it represents.
This divided bar graph displays the number of people per day who visited swimming pool.
The divided bar diagram template for the ConceptDraw PRO diagramming and vector drawing software is included in the Divided Bar Diagrams solution from the Graphs and Charts area of ConceptDraw Solution Park.
This divided bar graph displays the number of people per day who visited swimming pool.
The divided bar diagram template for the ConceptDraw PRO diagramming and vector drawing software is included in the Divided Bar Diagrams solution from the Graphs and Charts area of ConceptDraw Solution Park.
Divided bar chart template
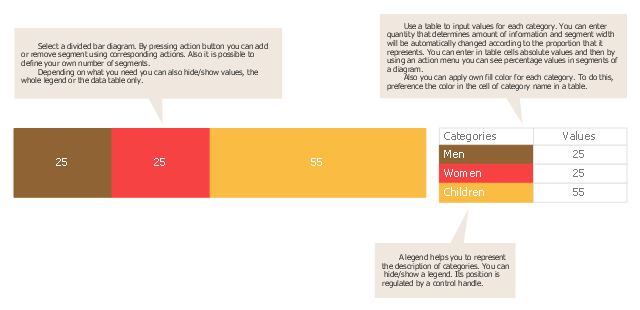
A Divided Bar graph is a rectangle divided into smaller rectangles along its length in proportion to the data. Segments in a Divided Bar represent a set of quantities according to the different proportions of the total amount.
Divided Bars are used for visual representation of the collected information.
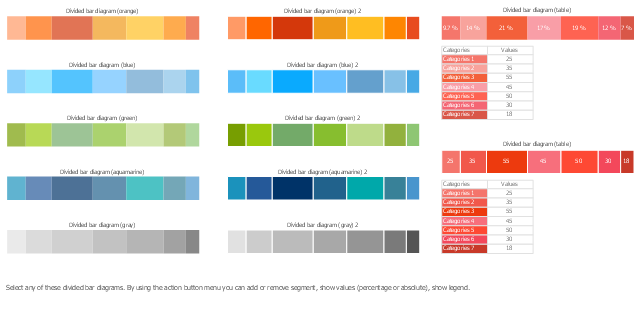
The design elements library Divided bar diagrams contains the 10 vector templates of divided bar charts.
Use the design elements library Divided bar diagrams to draw your diagrams and infographics using the ConceptDraw PRO diagramming and vector drawing software.
The example "Design elements - Divided bar diagrams" was created using ConceptDraw PRO diagramming and vector drawing software extended with the Divided Bar Diagrams solution from the Graphs and Charts area of ConceptDraw Solution Park.
Divided Bars are used for visual representation of the collected information.
The design elements library Divided bar diagrams contains the 10 vector templates of divided bar charts.
Use the design elements library Divided bar diagrams to draw your diagrams and infographics using the ConceptDraw PRO diagramming and vector drawing software.
The example "Design elements - Divided bar diagrams" was created using ConceptDraw PRO diagramming and vector drawing software extended with the Divided Bar Diagrams solution from the Graphs and Charts area of ConceptDraw Solution Park.
Divided bar chart templates
Bar Graph

 Basic Diagramming
This solution extends ConceptDraw PRO software with the specific tools you need to easily draw flowcharts, block diagrams, histograms, pie charts, divided bar diagrams, line graphs, circular arrows diagrams, Venn diagrams, bubble diagrams and concept maps
Bar Diagram Math

Chart Software for Better Presentations

Graphs and Charts Area provide a wide collection of professional looking predesigned templates, samples and ready-to-use vector stencils that will help you to draw the charts and diagrams of various types: Pie Charts, Donut Charts, Line Charts, Column Charts, Bar Charts, Pyramids, Scatter Charts, Venn Diagrams, Spider Charts, Area Charts, Divided Bar Graphs.
Basic Diagramming


The vector stencils library "Composition charts" contains 6 templates: 2 pie charts, 2 divided bar charts and 2 double divided bar charts.
The vector stencils library "Composition indicators" contains 6 templates of visual indicators.
Use these design elements to visualize composition comparison of your data in your visual dashboard created using the ConceptDraw PRO diagramming and vector drawing software.
"A pie chart (or a circle graph) is a circular chart divided into sectors, illustrating numerical proportion. In a pie chart, the arc length of each sector (and consequently its central angle and area), is proportional to the quantity it represents. While it is named for its resemblance to a pie which has been sliced, there are variations on the way it can be presented. ...
An obvious flaw exhibited by pie charts is that they cannot show more than a few values without separating the visual encoding (the “slices”) from the data they represent (typically percentages). When slices become too small, pie charts have to rely on colors, textures or arrows so the reader can understand them. This makes them unsuitable for use with larger amounts of data. Pie charts also take up a larger amount of space on the page compared to the more flexible alternative of bar charts, which do not need to have separate legends, and can also display other values such as averages or targets at the same time. ...
Most subjects have difficulty ordering the slices in the pie chart by size; when the bar chart is used the comparison is much easier. Similarly, comparisons between data sets are easier using the bar chart. However, if the goal is to compare a given category (a slice of the pie) with the total (the whole pie) in a single chart and the multiple is close to 25 or 50 percent, then a pie chart can often be more effective than a bar graph." [Pie chart. Wikipedia]
The example "Design elements - Composition charts and indicators" is included in the Composition Dashboard solution from the area "What is a Dashboard" of ConceptDraw Solution Park.
Composition charts and visual indicators

 ConceptDraw Solution Park
ConceptDraw Solution Park collects graphic extensions, examples and learning materials
Picture Graph

Scatter Graph

Pie Graph Worksheets

What Is a Picture Graph?

Relative Value Chart Software

Relative values are widely used in:business, economics, investment, management, marketing, statistics, etc.
ConceptDraw PRO software is the best for drawing professional looking Relative Value Charts. ConceptDraw PRO provides Divided Bar Diagrams solution from the Graphs and Charts Area of ConceptDraw Solution Park.
 Line Graphs
Line Graphs solution extends ConceptDraw PRO software with templates, samples and library of vector stencils for drawing the line charts.
Pictures of Graphs

- Divided bar diagram - Template
- Divided bar diagram template
- Bar Graphs | Picture Graphs | Divided Bar Diagrams | Bar Graphs On ...
- Divided Bar Diagrams | Basic Diagramming | Design elements ...
- Divided Bar Diagrams
- Design elements - Divided bar diagrams
- Bar Chart Software | Bar Chart Examples | Bar chart template | _bar ...
- The Best Drawing Program for Mac | Divided Bar Diagrams | Visual ...
- Bar Graphs | Bar Diagrams for Problem Solving. Create event ...
- Create Graphs and Charts | Line Graph Charting Software ...
- Divided bar graph - Global natural gas consumption (2010) | Divided ...
- Divided bar graph - Global natural gas consumption (2010) | Bar ...
- Bar Chart Template
- Basic Diagramming | Picture Graphs | Create Graphs and Charts ...
- Divided Bar Diagrams | How to Draw a Divided Bar Cahrt ...
- Divided bar diagram template | Design elements - Divided bar ...
- Bar Graphs | Bar Chart Software | Bar Chart Examples | Bar Diagram
- Bar Chart Examples | Bar Chart Software | Bar Graphs | Bar Graph ...
- Picture graph template | Basic Diagramming | The Best Drawing ...
- Arrow graph - Total value of manufacturers' shipments | Basic ...