HelpDesk
How to Draw a Divided Bar Chart

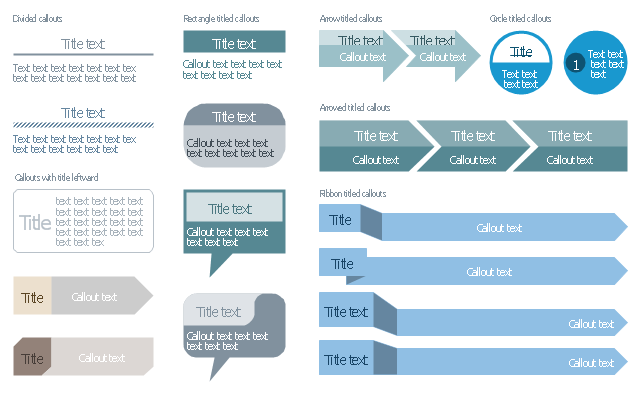
The vector stencils library "Management titled callouts" contains 20 divided rectangle callouts, rounded rectangle callouts, circle callouts, speech balloons, arrow callouts.
Use it to create your management infograms.
The infographic shapes example "Design elements - Management titled callouts" was created using the ConceptDraw PRO diagramming and vector drawing software extended with the Management Infographics solition from the area "Business Infographics" in ConceptDraw Solution Park.
Titled callout blocks
 Basic Divided Bar Diagrams
This solution extends the capabilities of ConceptDraw DIAGRAM (or later) with templates, samples and a library of vector stencils for drawing Divided Bar diagrams.
 Divided Bar Diagrams
The Divided Bar Diagrams Solution extends the capabilities of ConceptDraw DIAGRAM with templates, samples, and a library of vector stencils for drawing high impact and professional Divided Bar Diagrams and Graphs, Bar Diagram Math, and Stacked Graph.
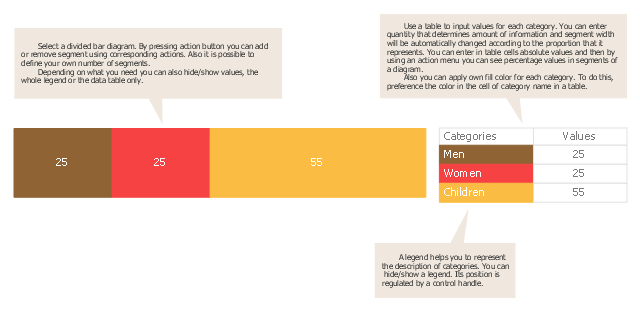
Use this chart template to design your divided bar diagrams.
A divided bar chart is a rectangle divided into segments, illustrating numerical proportion. In a divided bar chart, the length of each segment (and consequently its area), is proportional to the quantity it represents.
This divided bar graph displays the number of people per day who visited swimming pool.
The template "Divided bar diagram" for the ConceptDraw PRO diagramming and vector drawing software is included in the Divided Bar Diagrams solution from the Graphs and Charts area of ConceptDraw Solution Park.
Template
Basic Flowchart Symbols and Meaning


Relative Value Chart Software

A divided bar diagram is a rectangle divided into segments along its length. The segment sizes represent percent composition of one total consisting of few parts.
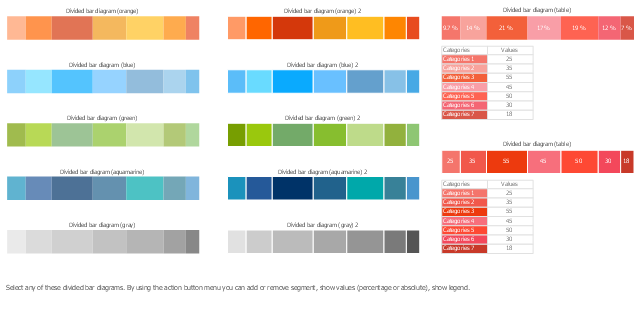
The vector stencils library "Divided bar diagrams" contains 12 chart templates.
Use it to draw your diagrams and infographics using the ConceptDraw PRO diagramming and vector drawing software.
The chart templates example "Design elements - Divided bar diagrams" is included in the Divided Bar Diagrams solution from the Graphs and Charts area of ConceptDraw Solution Park.
Templates
 Education Package
Education Package is a comprehensive set of multifarious graphical solutions from ConceptDraw Solution Park, collected together in help to ConceptDraw DIAGRAM users working in a field of science, education and training, which is aimed at improving the quality of education and helping to design with ease variety of interesting and colorful educational materials, diagrams, charts and maps. Use it to present the information and knowledge in an interesting, clear, structured and simple form to achieve a success in education and pedagogy, to maintain the interest of students and pupils throughout the whole learning process, at the lectures, lessons and even during independent work with additional materials, to contribute to better perception of scientific information by listeners during the conferences and reports.
Ice Hockey Rink Dimensions

- Steps Used To Draw Divided Rectangle
- Divided Rectangle Graph
- Using A Divided Rectangle To Represent Data
- How To Draw A Divided Rectangle In Geography
- Divided Rectangle Diagram In Geography
- | Advantages Of Divided Rectangle Bar Graph
- Compoud Divided Rectangle
- Procedures Steps By Steps Of Drawing Divided Rectangle
- How To Draw Divided Rectangle Of 10th Geography
- Divided Bar Diagrams | Competitor Analysis | Divided Rectangle In ...