Timeline Examples
ConceptDraw PRO diagramming and vector drawing software offers the Timeline Diagrams solution from the Management area which is rich for the timeline examples, samples, templates and ready-to-use vector shapes.Project Timeline
Project timeline is a type of chart which allows visually represent the chronology of works for the project, placing the key points of the project (milestones) on a timescale. You need to make professional looking project timeline? Create it with ConceptDraw PRO! ConceptDraw PRO extended with Timeline Diagrams Solution from the Management Area is the best timeline diagrams software
 Timeline Diagrams
Timeline Diagrams solution extends ConceptDraw PRO diagramming software with samples, templates and libraries of specially developed smart vector design elements of timeline bars, time intervals, milestones, events, today marker, legend, and many other elements with custom properties, helpful for professional drawing clear and intuitive Timeline Diagrams. Use it to design simple Timeline Diagrams and designate only the main project stages, or highly detailed Timeline Diagrams depicting all project tasks, subtasks, milestones, deadlines, responsible persons and other description information, ideal for applying in presentations, reports, education materials, and other documentation.
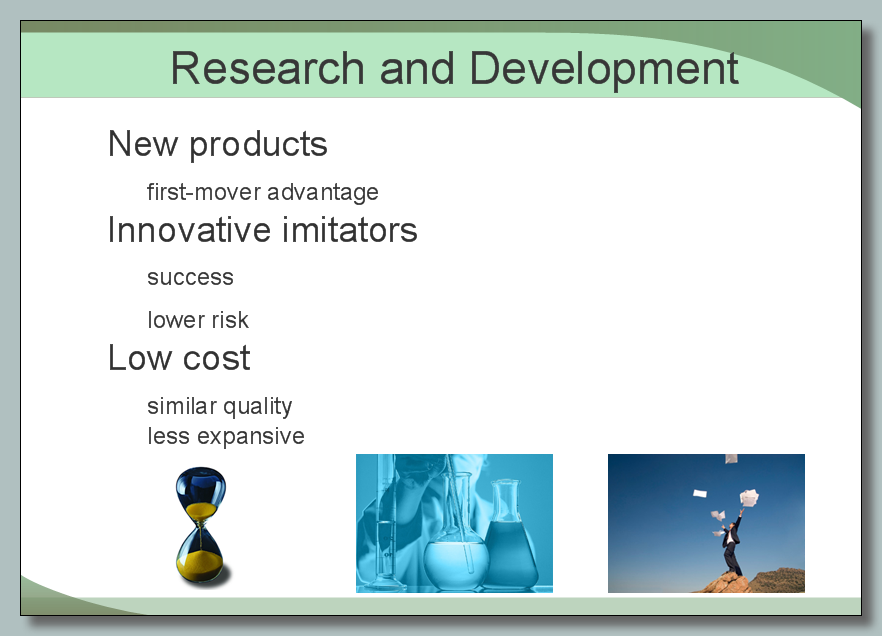
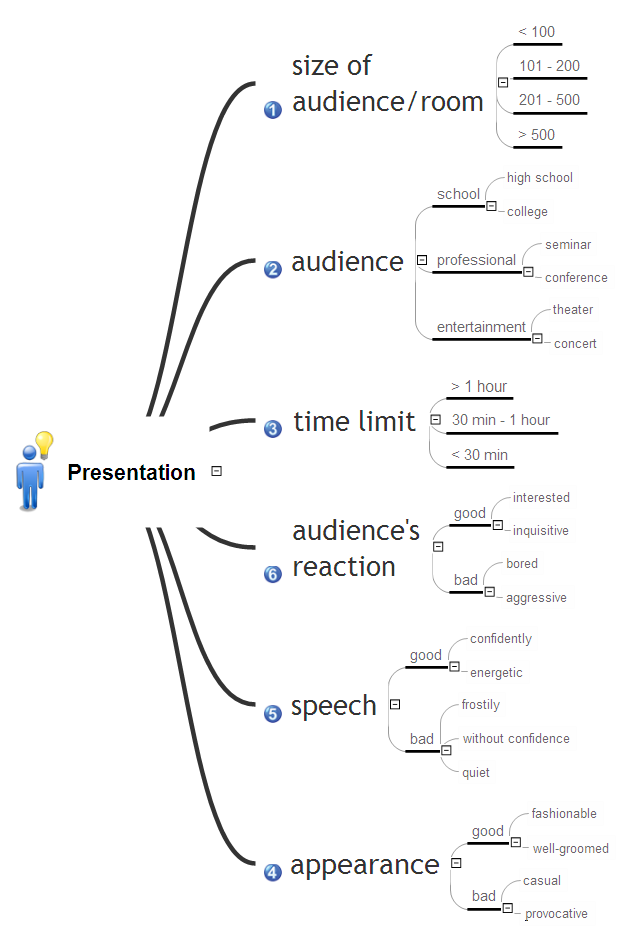
Softness Presentation
The choice of appropriate style is very important moment in preparation and planning the presentation. There are many possible presentation styles – from the elegant black-white graphics made from slides to complex 3D multimedia presentations with effects, animation and music. The choice of style depends on your audience, objectives, content of speech, the budget, time and used software. If the content of your speech is formal, contains a progress report or depicts financial status of the firm, or if you talk with a huge audience of strangers, the style of presentation needs to be the same and to correspond to importance of event. But if all present are familiar to you and their number is small, it is permissible to deviate slightly from the formal speech for better perception. ConceptDraw MINDMAP is ideal software for creation attractive presentations. Choose the style of presentation so that the key points of your speech were saved in memory of audience. Use all your creativity to create a memorable presentation, effective tools for this are already provided by ConceptDraw MINDMAP. Designed presentation with softness style contains illustrations and notes from Mind Map document.Business Process
A business process is an activity or set of related and structured activities or tasks, which are used to accomplish a specific organizational goals, are directed on the production some specific product or service for particular customers. To measure the success of the business process within an organization is used the tracking of benchmarks, for improvement the business processes is applied the approach named as business process management. For visual depiction and modeling the business processes are successfully used the Mind Maps and Flowcharts. ConceptDraw MINDMAP is ideal software for business process mapping, business process diagramming and business modeling. It offers all needed tools for fast and easy designing the Business Process Mind Maps and Business Process Diagrams (Process Charts, Business Process Modeling Diagrams, Cross-Functional Flowcharts, Workflows, Timeline Diagrams, Calendars, Gantt Charts, IDEF0 and IDEF2, Audit and Opportunity Flowcharts), for visual documenting and communication the business process information, creation vivid presentations.Swim Lane Flowchart Symbols
Use the set of special professionally developed swim lane flowchart symbols - single, multiple, vertical and horizontal lanes from the Swimlanes and Swimlanes BPMN 1.2 libraries from the Business Process Diagram solution, the Swim Lanes library from the Business Process Mapping solution as the perfect basis for your Swim Lane Flowcharts of processes, algorithms and procedures.How to Report Task's Execution with Gantt Chart
ConceptDraw PROJECT’s powerful reporting engine lets you generate a set of tabular reports with just one click, or visualize your project as Radial Tasks Structures, Work Breakdown Structures and Resource Calendars. It also provides you with dynamic Project Dashboards.
 Quality Mind Map
This solution extends ConceptDraw MINDMAP software with Quality Management Mind Maps (Presentations, Meeting Agendas, Problem to be solved).
Risk Diagram (Process Decision Program Chart)
The risk is a probable event in result of which may occur the negative events and adverse consequences. The risk management is a very important process in any field, it is a process of making the management decisions aimed on the reducing the likelihood of appearing the unfavorable results and on the minimizing potential losses, as well as the implementation of these solutions. The main purpose of applying the risk management is increasing of enterprise's competitiveness with help of protection against the risks. ConceptDraw MINDMAP software is perfect for identifying the risks, analyzing and managing risks, for designing Risk Diagrams, for developing effective actions in response to circumstances and potential obstacles that were identified as risks. It is also the best for designing Process Decision Program Charts and representing the PDPC method, which is effective way of detailed planning and depiction the whole sequence of actions on the path from the formulation a problem to its solution. The PDPC lets determine the risks when corrective actions are not performed correctly and helps develop descriptions for preventive actions.- Example Of Basic Communication Meeting In Flowchart
- How To Create Good Presentation Ideas | Timeline Diagrams ...
- How to Make a Mind Map from a Project Gantt Chart ...
- Quality visualization in your company | Business Process Workflow ...
- Pyramid Diagram | Project Timeline | Project — Assigning ...
- ConceptDraw PRO Compatibility with MS Visio | Diagramming ...
- Project Timeline | Timeline Examples | Timeline Diagrams ...
- Emergency Action Plan Template | Project Timeline | How to Create ...
- How to Create a Timeline Diagram in ConceptDraw PRO | Timeline ...
- Meeting Agenda Map | Sprint Planning Meeting Agenda | PM Agile ...


