Basic Flowchart Symbols and Meaning


HelpDesk
How to Create a Meter Dashboard

 Meter Dashboard
Meter dashboard solution extends ConceptDraw PRO software with templates, samples and vector stencils library with meter indicators for drawing visual dashboards showing quantitative data.
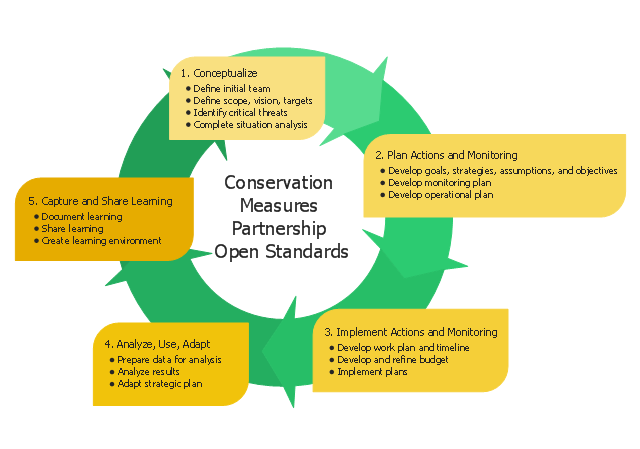
This circular arrows diagram sample shows five steps of the Conservation Measures Partnership (CMP) adaptive management cycle. It was designed on the base of the Wikimedia Commons file: CMP Cycle - 2008-02-20.jpg.
[commons.wikimedia.org/ wiki/ File:CMP_ Cycle_ -_ 2008-02-20.jpg]
"Adaptive management (AM), also known as adaptive resource management (ARM), is a structured, iterative process of robust decision making in the face of uncertainty, with an aim to reducing uncertainty over time via system monitoring. In this way, decision making simultaneously meets one or more resource management objectives and, either passively or actively, accrues information needed to improve future management. Adaptive management is a tool which should be used not only to change a system, but also to learn about the system. Because adaptive management is based on a learning process, it improves long-run management outcomes. The challenge in using the adaptive management approach lies in finding the correct balance between gaining knowledge to improve management in the future and achieving the best short-term outcome based on current knowledge.
Application to environmental projects and programs.
Open Standards for the Practice of Conservation lay out 5 main steps to an adaptive management project cycle." [Adaptive management. Wikipedia]
The diagram example "CMP adaptive management cycle" was created using the ConceptDraw PRO diagramming and vector drawing software extended with the Circular Arrows Diagrams solution from the area "What is a Diagram" of ConceptDraw Solution Park.
Circular arrows diagram
Used Solutions
SWOT Analysis

Cross-Functional Flowchart


Social Media Marketing Infographic

Typography Infographic Software

HelpDesk
How to Create Management Infographics Using ConceptDraw PRO

Typography Art

This vector stencils library contains 184 round icons.
Use it to design cloud computing infographics and diagrams with ConceptDraw PRO software.
"Though service-oriented architecture advocates "everything as a service" (with the acronyms EaaS or XaaS or simply aas), cloud-computing providers offer their "services" according to different models, which happen to form a stack: infrastructure-, platform- and software-as-a-service.
Infrastructure as a service (IaaS)
In the most basic cloud-service model ... providers of IaaS offer computers — physical or (more often) virtual machines — and other resources. IaaS refers to online services that abstract the user from the details of infrastructure like physical computing resources, location, data partitioning, scaling, security, backup etc.
Platform as a service (PaaS)
PaaS vendors offer a development environment to application developers. The provider typically develops toolkit and standards for development and channels for distribution and payment. In the PaaS models, cloud providers deliver a computing platform, typically including operating system, programming-language execution environment, database, and web server. Application developers can develop and run their software solutions on a cloud platform without the cost and complexity of buying and managing the underlying hardware and software layers.
Software as a service (SaaS)
In the software as a service (SaaS) model, users gain access to application software and databases. Cloud providers manage the infrastructure and platforms that run the applications. SaaS is sometimes referred to as "on-demand software" and is usually priced on a pay-per-use basis or using a subscription fee.
In the SaaS model, cloud providers install and operate application software in the cloud and cloud users access the software from cloud clients. Cloud users do not manage the cloud infrastructure and platform where the application runs. This eliminates the need to install and run the application on the cloud user's own computers, which simplifies maintenance and support. Cloud applications differ from other applications in their scalability — which can be achieved by cloning tasks onto multiple virtual machines at run-time to meet changing work demand." [Cloud computing. Wikipedia]
The vector stencils library "Cloud round icons" is included in the Cloud Computing Diagrams solution from the Computer and Networks area of ConceptDraw Solution Park.
Add
Analysis
API
App
Archive
Back
Backup
Book
Books
Box
Bug
Calculation
Calendar
Call
Car
CD
Certificate
Cloud alert
Cloud analysis
Cloud authorization
Cloud collaboration
Cloud communications
Cloud computing
Cloud configuration
Cloud connectivity
Cloud control
Cloud cost calculation
Cloud database
Cloud download
Cloud drive
Cloud error
Cloud failure
Cloud FAQ
Cloud feedback
Cloud files
Cloud gateway
Cloud hosting
Cloud info
Cloud Internet storage
Cloud lock
Cloud locked
Cloud mail
Cloud music
Cloud paperless office
Cloud performance
Cloud photo
Cloud safe
Cloud search
Cloud security
Cloud servers
Cloud services
Cloud shopping
Cloud success
Cloud synchronization
Cloud tech support
Cloud transfer
Cloud unlocked
Cloud upload
Cloud video
Code
Collaboration
Communication
Community cloud
Contact list
Content
CPU
Database
Datacenter
Data storage
Desktop
Display
Document
Documents
Dollar
Done
Down
Download
E-commerce
Earth
Email
Encryption
Error
Ethernet
Euro
Failure
Feed
File
Files
Filter
Firewall
Flash drive
Folder
Forward
Hard drive
Hardware
Health
Health monitoring
Home
Hosting
Image
Info
Innovation
Key
Keyboard
Laptop
Letter
Lightning
Link
List
Location
Lock
Log
Login
Logout
Mail
Mail list
Marketplace
Memory (RAM)
Message
Minus
Mobile
Mobile cloud computing
Mouse
Music player
Network
Notebook
Notification
Package
Patch
Performance
Personal cloud
Phone book
Photo
Plug
Pound
Power
Power button
Process
Processing
Puzzles
Question sign
Recovery
Remote
Repair
Restore
Rocket (Logic app)
Router
Safety
Schedule
Script
SDK
Search (Scan)
Security
Server
Server rack
Services
Sharing
Shopping basket
Sign in
Smartphone
Song
Sound
Stethoscope
Stickman
Subscription
Sync
Tablet
Tech support
Time
Top rated
Transfer
Unlink
Unlock
Up
Upload
User
Video mail
View (visual)
Virus protection
Waste bin
Web
Wifi
Wireless
Yen sign
Basic Flowchart Examples

Wireframe Tools

Website Wireframe

- Bullet Library Ms Word Png
- Marketing infogram 5 - Template | Basic Flowchart Symbols and ...
- Bullet Point Png
- Bullet Icon Png
- Bullet Symbols Png File
- The Facts and KPIs | Export from ConceptDraw PRO Document to a ...
- Writing Hand Vector Png
- Export from ConceptDraw PRO Document to a Graphic File ...
- Export from ConceptDraw PRO Document to a Graphic File ...
- Bullet Point Arrow
- Cloud clipart - Vector stencils library | Travel Safe Vector Png
- Export from ConceptDraw PRO Document to a Graphic File ...
- Glyph icons - Vector stencils library | Glyph Png Mobile
- Management And Interaction Png
- Right Symbols Png
- Radial Arrow Png
- Increase Sales Vector Png
- Microsoft Azure | Planning documents flowdown | Data management ...
- Export from ConceptDraw PRO Document to a Graphic File | Scrum ...
- Plc Icon Png