HelpDesk
Accounting Information Systems Flowchart Symbols
Accounting Information system is a combination of software and hardware, as well as organizational support. Information system - it is not only the software and computers with network equipment, but also a list of instructions and standards which can be notated using Accounting information systems flowchart symbols. All information systems can be divided into information retrieval and data processing systems. Data Flow model is a hierarchical model. Each process can be divided into structural components, that depict by corresponding flowchart symbols, showing the accounting information system in communication with the external environment. The major components of accounting information systems flowchart are: entities, processes, data stores, and data flows. The set of standard accounting information flowchart symbols is intended to show the relationships between the system components. ConceptDraw DIAGRAM can help to draw clear accounting information system diagrams using special flowchart symbols.
 Flowcharts
The Flowcharts solution for ConceptDraw DIAGRAM is a comprehensive set of examples and samples in several varied color themes for professionals that need to represent graphically a process. Solution value is added by the basic flow chart template and shapes' libraries of flowchart notation. ConceptDraw DIAGRAM flow chart creator lets one depict the processes of any complexity and length, as well as design the Flowchart either vertically or horizontally.
HelpDesk
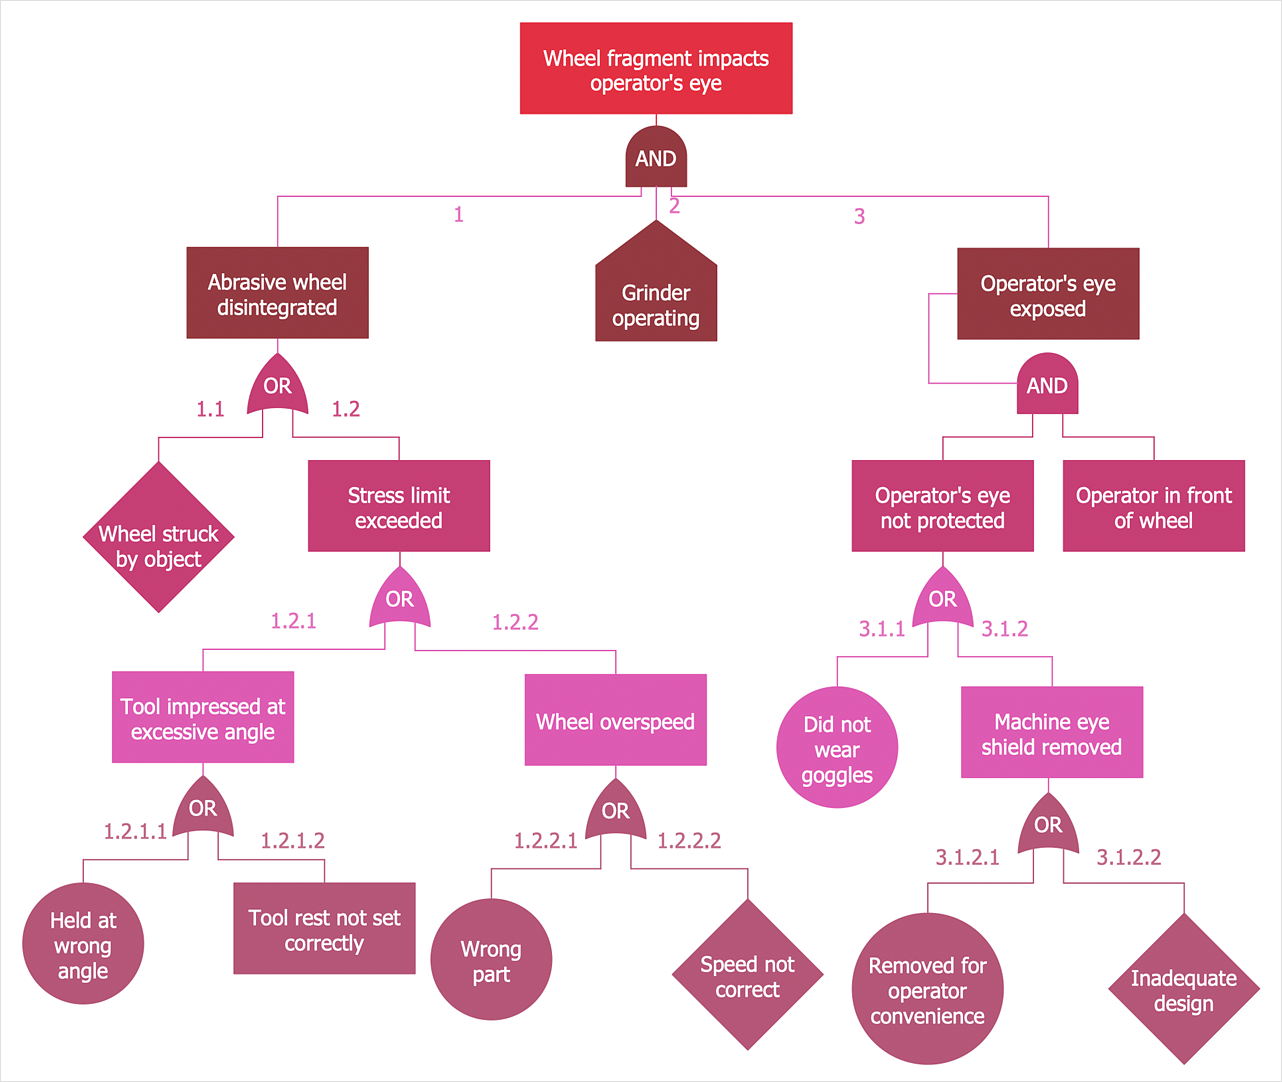
How to Create a Fault Tree Analysis Diagram (FTD)
Fault Tree Diagram is a logic diagram that shows the state of an entire system in a relationship of the conditions of its elements. Fault Tree Diagram is used to analyze the probability of functional system failures and safety accidents. ConceptDraw DIAGRAM allows you to create professional Fault Tree Diagrams using the basic FTD symbols. An FTD visualizes a model of the processes within a system that can lead to the unlikely event. A fault tree diagrams are created using standard logic symbols. The basic elements in a fault tree diagram are gates and events.Software development with ConceptDraw DIAGRAM
Modern software development requires creation of large amount of graphic documentation, these are the diagrams describing the work of applications in various notations and cuts, also GUI design and documentation on project management. ConceptDraw DIAGRAM technical and business graphics application possesses powerful tools for software development and designing technical documentation for object-oriented projects. Solutions included to the Software Development area of ConceptDraw Solution Park provide the specialists with possibility easily and quickly create graphic documentation. They deliver effective help in drawing thanks to the included package of templates, samples, examples, and libraries with numerous ready-to-use vector objects that allow easily design class hierarchies, object hierarchies, visual object-oriented designs, flowcharts, GUI designs, database designs, visualize the data with use of the most popular notations, including the UML and Booch notations, easy manage the development projects, automate projection and development.- Flow Chart Of Analysis Phase
- Data Flow Diagram In Analysis Phase
- Data Flow Diagram Example In Sdlc Phases
- Process Flowchart | Structured Systems Analysis and Design ...
- Which Phase Of Sdlc Uses Dataflow Diagrams
- Process Flowchart | Structured Systems Analysis and Design ...
- In Which Phase Of Sdlc Flow Charts Are Drawn
- Structured Systems Analysis and Design Method (SSADM) with ...
- Process Flowchart | Data Flow Diagram Software | Data Flow ...
- Process Flowchart | Data Flow Diagram Process | Structured ...
- Dfd In Whch Phases Of Software Development They Are Required
- Process Flowchart | Structured Systems Analysis and Design ...
- Flowchart Marketing Process. Flowchart Examples | Flowchart ...
- Swim Lane Flowchart Symbols | Cross-Functional Flowchart (Swim ...
- Structured Systems Analysis and Design Method (SSADM) with ...
- Basic Flowchart Symbols and Meaning | Audit Flowchart Symbols ...
- Process Flowchart | Structured Systems Analysis and Design ...
- Systems development life cycle | Circular Flow Diagram Template ...
- Data Flow Diagram (DFD) | Process Flowchart | Data Flow Diagrams ...
- Cross-Functional Flowchart | Business Processes description with ...


