How to Create a Pie Chart
Create a Pie Chart with ConceptDraw software quickly and easily. The simple tutorial helps you learn how to create a pie chart.How to Draw EPC Diagram Quickly
An event-driven process chain diagram is a flowchart used in business process analysis. It evolved from Architecture of Integrated Information Systems (ARIS) and utilised in the business process improvement and analysis. It is also used to facilitate enterprise resource planning. An EPC diagram is a complex flowchart that shows different business processes through various workflows. The workflows are seen as functions and events that are connected by different teams or people, as well as tasks that allow business processes to be executed. ConceptDraw PRO is a software for making EPC diagrams that allows managers visually present business process models for making decisions for business.
Area Chart
ConceptDraw PRO diagramming and vector drawing software offers the Area Charts solution from the Graphs and Charts area of ConceptDraw Solution Park for quick and easy drawing the Area Chart of any complexity.Fishbone Diagram Problem Solving
The Ishikawa diagram, Cause and Effect diagram, Fishbone diagram — all they are the names of one and the same visual method for working with causal connections. Originally invented by Kaoru Ishikawa to control the process quality, the Ishikawa diagram is well proven in other fields of management and personal scheduling, events planning, time management. It is a chart in the form of a fish, whose head is a problem, the fins are variants for its causes. To design easily the Fishbone diagram, you can use a special ConceptDraw PRO vector graphic and diagramming software which contains the powerful tools for Fishbone diagram problem solving offered by Fishbone Diagrams solution for the Management area of ConceptDraw Solution Park.Donut Chart
ConceptDraw PRO diagramming and vector drawing software offers the Pie Charts solution from the Graphs and Charts area which includes the tools for quick and easy designing any kind of Donut Chart.Step Area Graph
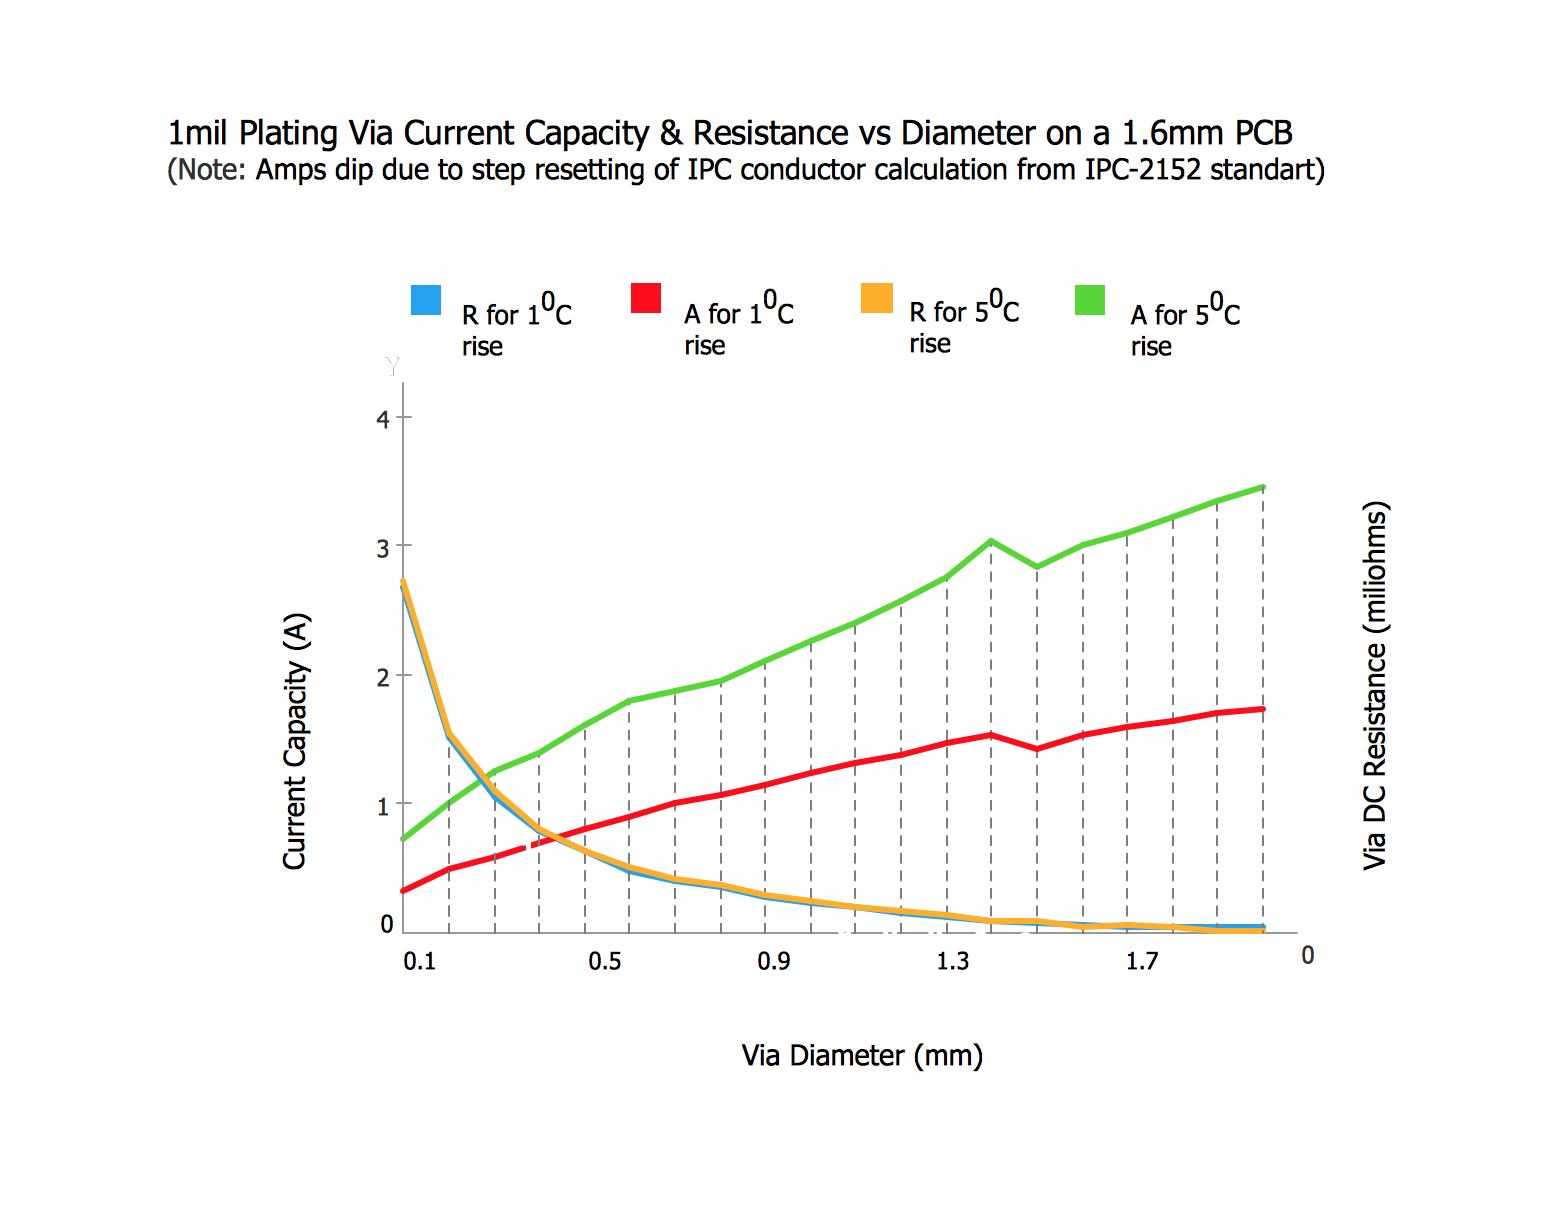
This sample shows the Step Area Graph of the PCB (Printed circuit board) Via current capacity and can be useful in electronics. It is displayed 1 mil plating Via current capacity and the resistance vs diameter on a 1.6 mm PCB. A via is an electrical connection between the layers in the electronical circuit that in PCB consists of two pads on the different electrically connected layers of the board.How to Draw an Effective Flowchart
Use ConceptDraw PRO diagramming and business graphics software to draw your own flowcharts of business processes.
 Basic Pie Charts
This solution extends the capabilities of ConceptDraw PRO v10.3.0 (or later) with templates, samples, and a library of vector stencils for drawing pie and donut charts.
 Circle-Spoke Diagrams
Examples of subject areas that are well suited to this approach are marketing, business, products promotion, process modeling, market, resource, time, and cost analysis. Circle-Spoke Diagrams are successfully used in presentations, conferences, management documents, magazines, reportages, reviews, reports, TV, and social media.
 eLearning for Skype
This solution extends ConceptDraw MINDMAP software with the ability to prepare and run remote learning sessions by using Skype
- Georgia DOT performance management - Meter dashboard ...
- How To Create a Flow Chart in ConceptDraw | Human Resource ...
- HR arrows - Vector stencils library | Circular diagrams - Vector ...
- Employee distribution - HR dashboard | Frequency Distribution ...
- Health Food | HR arrows - Vector stencils library | Design elements ...
- Employee distribution - HR dashboard | HR Dashboard | Frequency ...
- Projects HR dashboard | Employee distribution - HR dashboard ...
- Employee distribution - HR dashboard | Projects HR dashboard | HR ...
- Employee distribution - HR dashboard | Projects HR dashboard ...


