HelpDesk
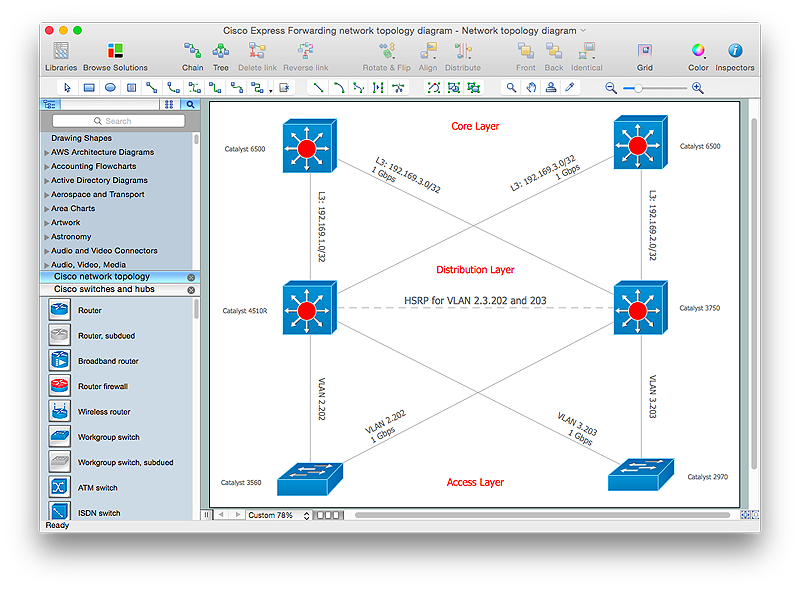
How to Create Cisco Network Diagrams
The easiest way to design Cisco Network diagram using standard Cisco product symbols is using ConceptDraw PRO powered by Cisco Network Diagrams solution.The Cisco Network Diagrams solution uses Cisco network symbols to to visually document the topology and design of Cisco networks.
HelpDesk
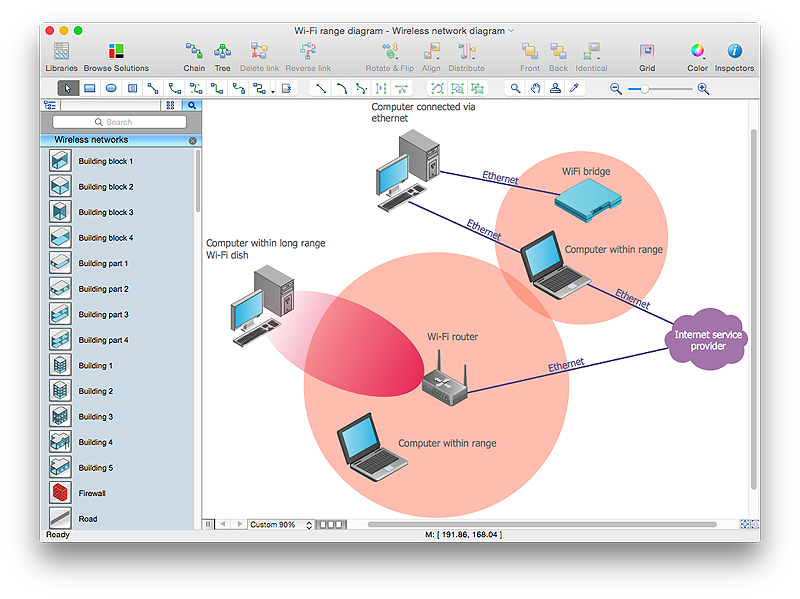
How to Create a Wireless Network Diagram
A wireless network diagram is a specialized type of computer network diagrams. Wireless Network diagrams are used to develop, operate and maintain the WLAN systems. Making a Wireless Network diagram involves many different elements that can be managed using ConceptDraw PRO. With ConceptDraw PRO you can easily create and communicate the Wireless Network diagram of any complexity.HelpDesk
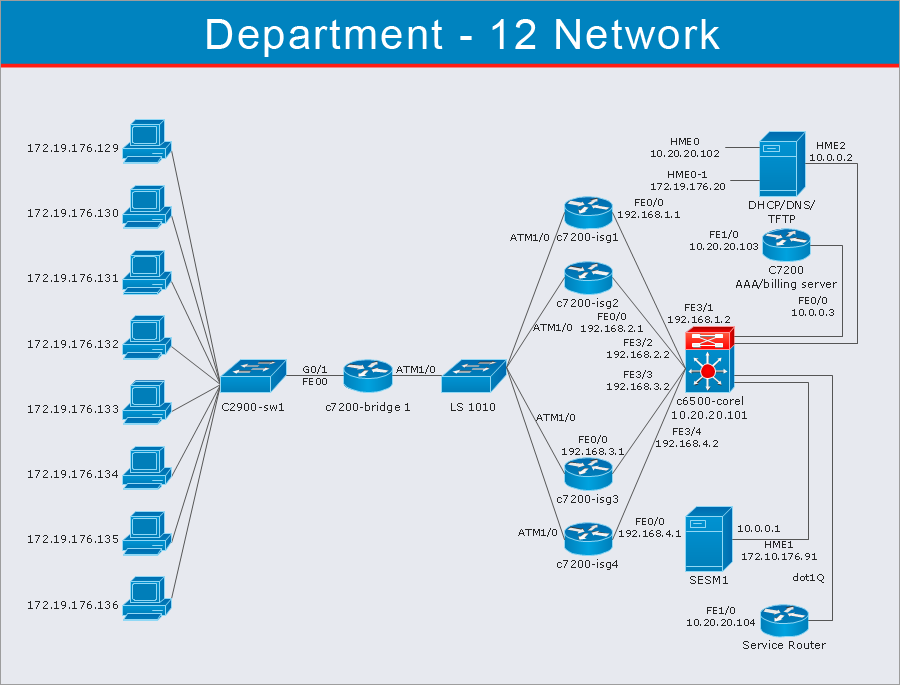
How to Make Network Diagram
ConceptDraw PRO allows you to represent and communicate network architecture, topology, and design to engineers, stakeholders and end-users.HelpDesk
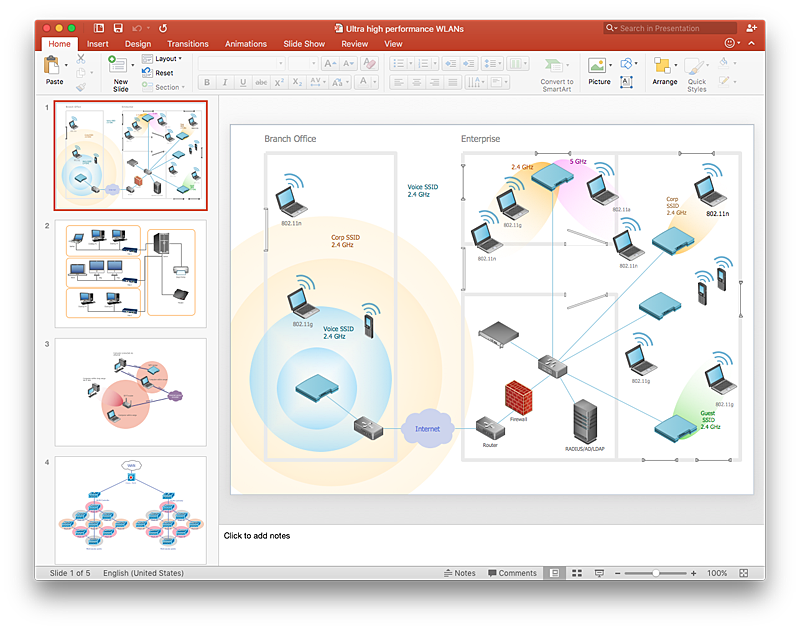
How to Add a Wireless Network Diagram to a PowerPoint Presentation Using ConceptDraw PRO
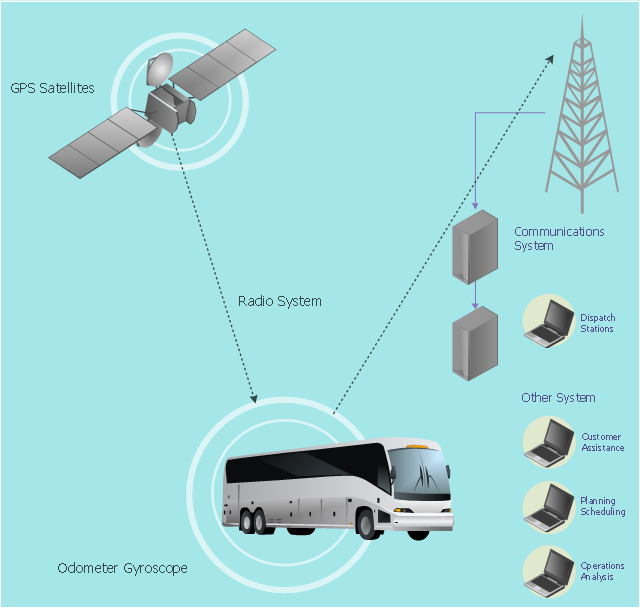
The PowerPoint presentation of wireless network can be very informative. ConceptDraw PRO allows you to easily create wireless network diagrams and then make a PowerPoint Presentation from your diagrams in a single click.This vehicular network diagram example was drawn on the base of picture illustrating the article "Automatic Vehicle Location: Rural Transit" from the website of the Research and Innovative Technology Administration (RITA), U.S. Department of Transportation (US DOT).
"Automatic Vehicle Location (AVL) systems calculate the real-time location of any vehicle equipped with a Global Positioning Satellite (GPS) receiver. Data are then transmitted to the transit center with use of radio or cellular communications and can be used immediately for daily operations as well as archived for further analysis.
As a stand-alone technology, an AVL system can be used to monitor on-time performance. When combined with other technologies, AVL can deliver many benefits in the areas of fleet management, service planning, safety and security, traveler information, fare payment, vehicle component monitoring, and data collection. Since the greatest benefits from AVL are achieved by combining it with other Intelligent Transportation System (ITS) technologies, AVL is most appropriate for large rural agencies with more than 30 vehicles that plan to implement a comprehensive ITS."
[pcb.its.dot.gov/ factsheets/ avl/ avlRural_ overview.asp]
The vehicular network diagram example "Automatic vehicle location" was created using the ConceptDraw PRO diagramming and vector drawing software extended with the Vehicular Networking solution from the Computer and Networks area of ConceptDraw Solution Park.
Used Solutions
HelpDesk
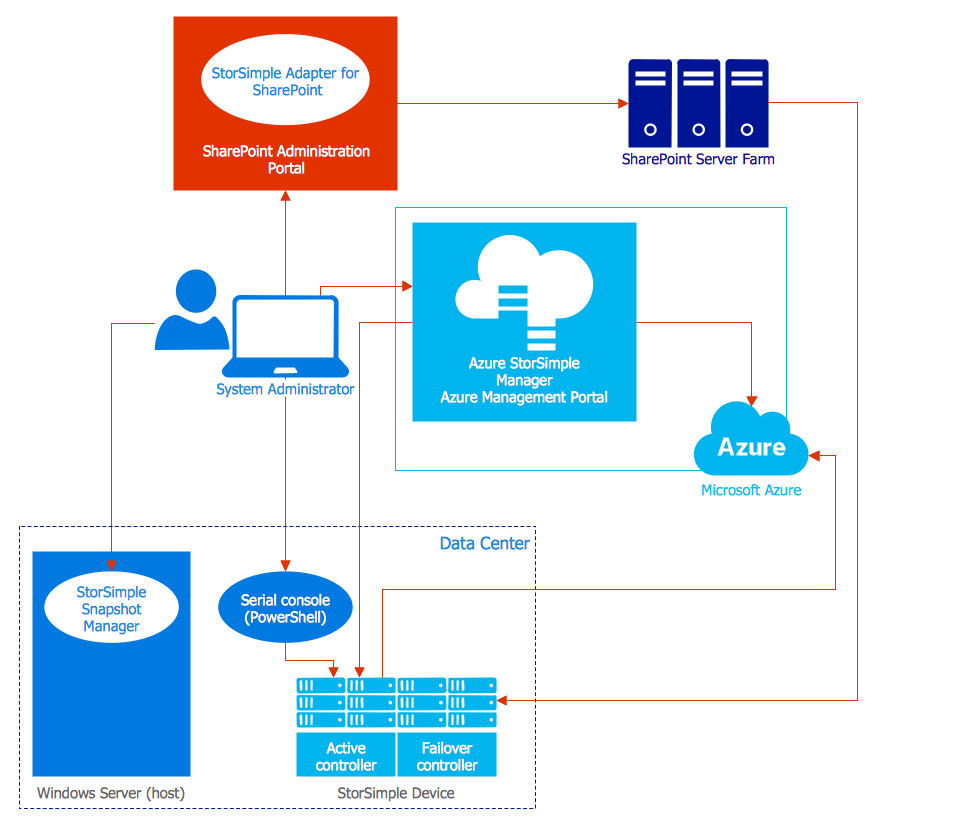
How to Create an Azure Architecture Diagram Using ConceptDraw PRO
Microsoft Azure is an open cloud computing platform, designed by Microsoft. It provides the ability to develop and launch applications and to store data on servers in distributed data centers. Microsoft Azure cloud offers two models - platform as a service (PaaS) and infrastructure as a service (IaaS). The efficiency of the Windows Azure platform is supported by a global network of Microsoft data centers. Developers use Azure Architecture diagrams to visualize and document the architecture of applications bases on Microsoft Azure services. Using the ConceptDraw Azure Architecture solution makes much easier the work on documenting the Microsoft Azure architecture.HelpDesk
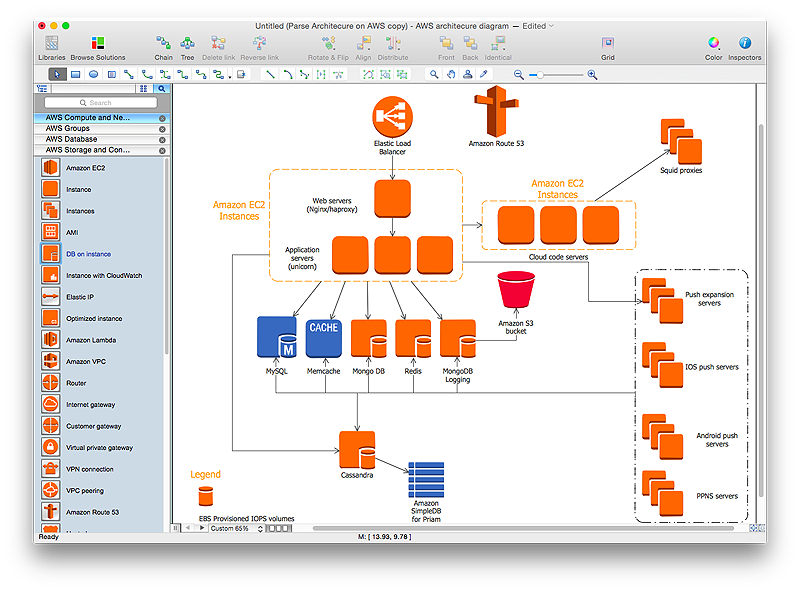
How to Create an AWS Architecture Diagram
Displaying an Amazon Web Service (AWS) cloud actually requires large amounts of attention to detail. Every element of technology has to be addressed: software, middle ware, transaction processing, scaling, data storage; the complete list is staggering. Using the ConceptDraw AWS Architecture Diagrams solution makes much easier the work on documenting the Amazon Web Service architecture. The ConceptDraw AWS Architecture Diagrams solution includes icons, sample and templates for some Amazon Web Services products and resources, to be used when buiding architecture diagrams. The icons are simple so that user can easily incorporate them in his drawings. AWS Architecture Diagrams can be used in presentations, datasheets, or any other technical visualizations.HelpDesk
How to Draw a Circle-Spoke Diagram Using ConceptDraw PRO
Making circle-spoke diagram is a very useful technique if you want to explore cause and effect. A Circle-Spoke Diagram is a tool that is often used in marketing sphere. Circle-spoke diagram consists from a central circle surrounded in a round arrangement by related sub-circles. They are used to depict the features or components of a central item in a number of areas. Circle-spoke diagram are widely used in marketing and management documents as well as presentations. A Circle-Spoke Diagram is a very useful tool if you want to perform the Cause and Effect analysis. ConceptDraw PRO delivers the ability to make circle-spoke diagrams of various styles with its Circle-Spoke Diagrams solution.HelpDesk
How to Create a Data Flow Diagram using ConceptDraw PRO
Data flow diagramming is a highly effective technique for showing the flow of information through a system. Data flow diagrams reveal relationships among and between the various components in a program or system. DFD is an important technique for modeling a system’s high-level detail by showing how input data is transformed to output results through a sequence of functional transformations. The set of standard symbols is used to depict how these components interact in a system. ConceptDraw PRO allows you to draw a simple and clear Data Flow Diagram using special libraries.HelpDesk
How to Draw a Block Diagram in ConceptDraw PRO
Block diagram is a simple chart that use blocks to show some elements or activities, and connectors that show the relationship between neighboring blocks. They are commonly simple, giving an overview of a process without necessarily going into the specifics of implementation. Block diagrams are commonly used to depict a general description of a system and its activity. A most known sample of a block diagram is a flow chart, used in many types of business as a common method of representing repeated processes. Easy and a simple creation, a number of objects and connectors make the block diagram a many-sided tool for various industries. The ability to make block diagrams is delivered by the ConceptDraw Block Diagrams solution.HelpDesk
How to Draw a Line Chart Quickly
A common line chart is a graphical representation of the functional relationship between two series of data. A line chart that is created by connecting a series of data points together with a straight line is the most basic type of a line chart. A line chart can be used for depicting data that changes continuously over time. It is extensively utilized in statistics, marketing and financial business. ConceptDraw Line Graph solution provides the possibility to make 2D line charts quickly and effortlessly.HelpDesk
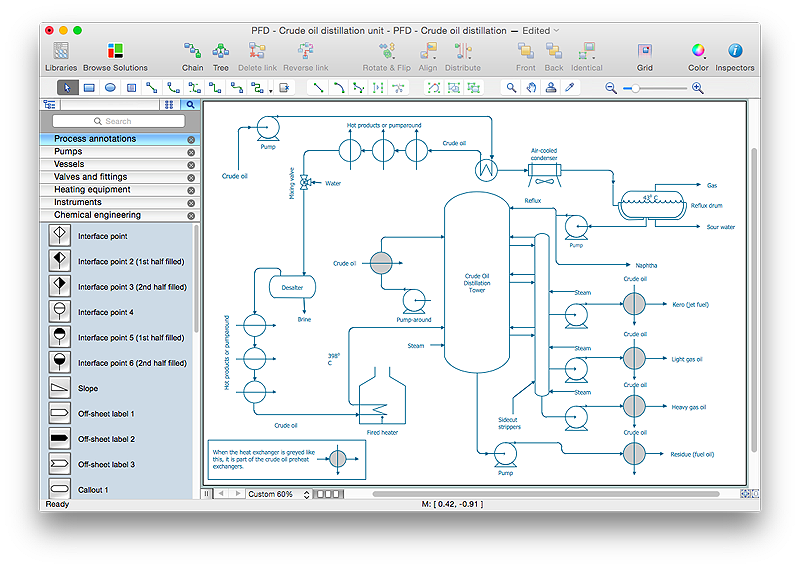
How to Draw a Chemical Process Flow Diagram
Process Flow Diagram widely used in modeling of processes in the chemical industry. A Chemical Process Flow diagram (PFD) is a specialized type of flowchart. With the help of Chemical Process Flow Diagram engineers can easily specify the general scheme of the processes and chemical plant equipment. Chemical Process Flow Diagram displays the real scheme of the chemical process, the relationship between the equipment and the technical characteristics of the process. Chemical Process Flow Diagram illustrates the connections between the basic equipment as well as the overall structure of pipelines and other supporting equipment. The purpose of the PFD is to build the image of the basic idea of the chemical process. ConceptDraw PRO together with its Chemical and Process Engineering solution delivers the possibility to design Chemical Process Flow diagrams. It is designed for chemical industry engineers and designers.HelpDesk
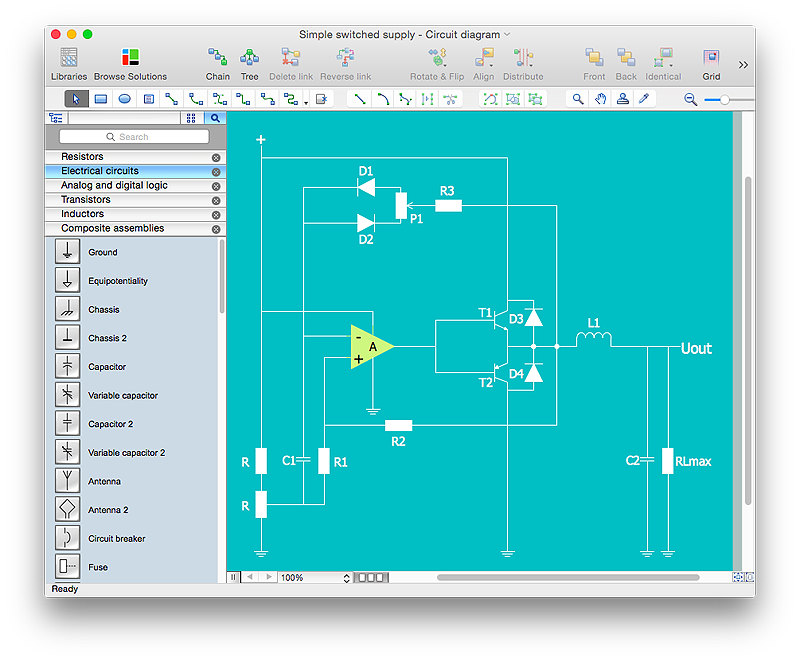
How to Draw an Electrical Scheme Using ConceptDraw Solution Park
The ability to visualize industrial systems in electronics, electrical, chemical, process, and mechanical engineering is delivered by the ConceptDraw Engineering solution.HelpDesk
How to Draw a Circular Arrows Diagram Using ConceptDraw PRO
The cyclic recurrence is a fundamental property of multiple systems. The cycle is a process which consists from elements (phases, stages, stages) following each other. Many processes in astronomy, biology, chemistry, physics, mathematics, etc. have a cycle properties. It is also widely used in information technologies and marketing analysis. Graphical representation of cyclic processes can have many forms. It can be a circle, parabola, hyperbola, ellipse and others. A Circular Arrows Diagram is used as one of the statistical charts in the business, mass media and marketing. ConceptDraw PRO provides its users tools for making easy drawing Circular Arrows Diagrams.HelpDesk
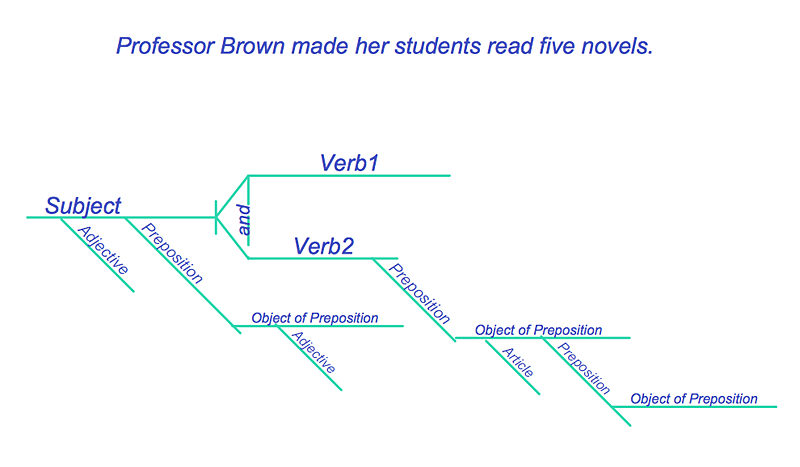
How to Diagram Sentences in ConceptDraw PRO
Diagramming sentences is a playful, fun way to learning English Grammer. Sentences can be very complex, and can contain many different parts of speech which implicate many different grammatical rules. Diagramming sentences will help you to make sure every parts of your sentence are grammatically correct, and provides you with more comprehensive understanding of the English Language. A Sentence Diagram displays the parts of a sentence as a diagram in order to show the relationship of words and groups of words within the sentence. Sentence Diagram shows the relationship between the proposal of its parts. This is a good way to teach grammar! Sentence Diagram helps to make the writing more coherent as well as more interesting to read. ConceptDraw PRO allows you to create clear sentence diagrams using the special templates and vector stencils library.- Computer Network Diagrams | Network Topologies | Bus Network ...
- Network Diagram Automatic
- Basic Network Diagram | Personal area (PAN) networks. Computer ...
- How to Create a Vehicular Network Diagram | Vehicular Networking ...
- Bus network topology diagram
- Automatic Network Diagram Software
- Vehicular Networking | How to Create a Vehicular Network Diagram ...
- Network diagrams with ConceptDraw PRO | Active Directory ...
- Vehicle Network
- Independent regional networks diagram
- Intelligent transportation system | Vehicular Networking | Global ...
- Automatic vehicle location | Vehicular Networking | Network ...
- Vehicular Networking | How to Create a Vehicular Network Diagram ...
- Wireless Networks | Wireless Network Diagram Examples | How to ...
- GPS operation diagram | Telecommunication Network Diagrams ...
- Vehicular Networking | How to Create a Vehicular Network Diagram ...
- Bus network topology diagram
- Telecommunication Network Diagrams | GPS operation diagram ...
- How to Draw a Circular Arrows Diagram in ConceptDraw PRO | How ...
- Network Topologies | Computer Network Diagrams | Bus Network ...
