Bar Chart Software
The best bar chart software ever is ConceptDraw. ConceptDraw bar chart software provides an interactive bar charting tool and complete set of predesigned bar chart objects.Chart Maker for Presentations
Easy charting software comes with beautiful chart templates and examples. This makes it easy to create professional charts without prior experience.Column Chart Software
ConceptDraw Column Chart software allows drawing column charts using predesigned objects or drawing tools. In ConceptDraw Column Chart software you can find a complete set of column chart tools and objects.How to Create a Bar Chart
The answer how to create a bar chart can be found in ConceptDraw software. The simple tips guide you through the software to quickly learn how to create a bar chart.How to Create a Column Chart
The question how to create a column chart have a simple answer. Use ConceptDraw tips to find out how to create a column chart depicts your data the best way.Chart Templates
Easy charting software comes with beautiful chart templates and examples. This makes it easy to create professional charts without prior experience.Basic Flowchart Symbols and Meaning
Flowcharts are the best for visually representation the business processes and the flow of a custom-order process through various departments within an organization. ConceptDraw PRO diagramming and vector drawing software extended with Flowcharts solution offers the full set of predesigned basic flowchart symbols which are gathered at two libraries: Flowchart and Flowcharts Rapid Draw. Among them are: process, terminator, decision, data, document, display, manual loop, and many other specific symbols. The meaning for each symbol offered by ConceptDraw gives the presentation about their proposed use in professional Flowcharts for business and technical processes, software algorithms, well-developed structures of web sites, Workflow diagrams, Process flow diagram and correlation in developing on-line instructional projects or business process system. Use of ready flow chart symbols in diagrams is incredibly useful - you need simply drag desired from the libraries to your document and arrange them in required order. There are a few serious alternatives to Visio for Mac, one of them is ConceptDraw PRO. It is one of the main contender with the most similar features and capabilities.
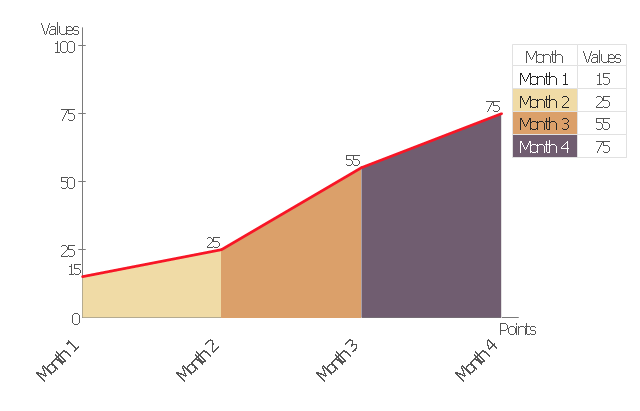
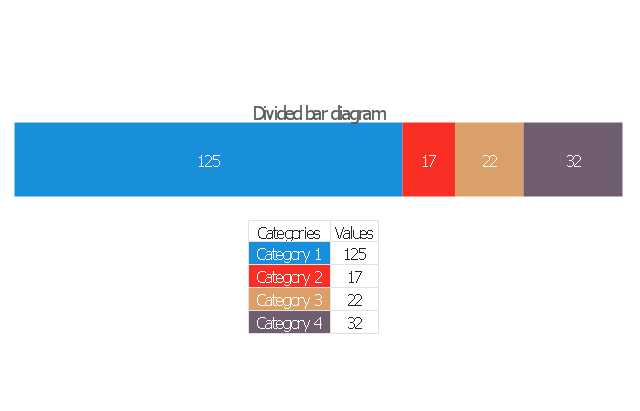
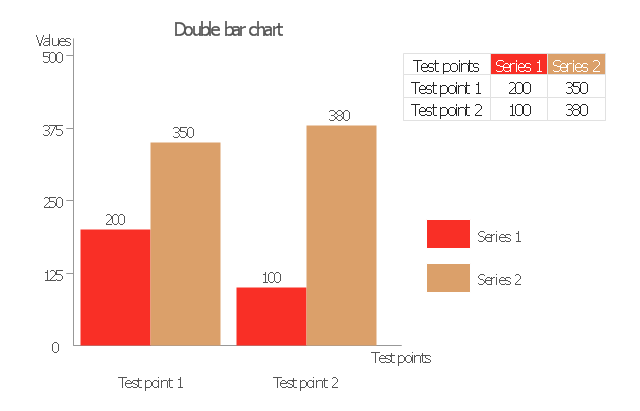
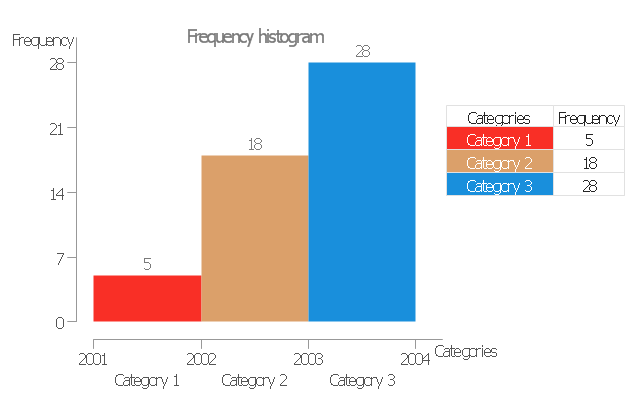
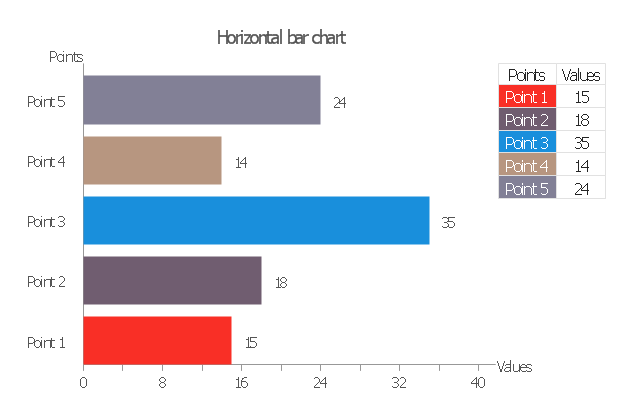
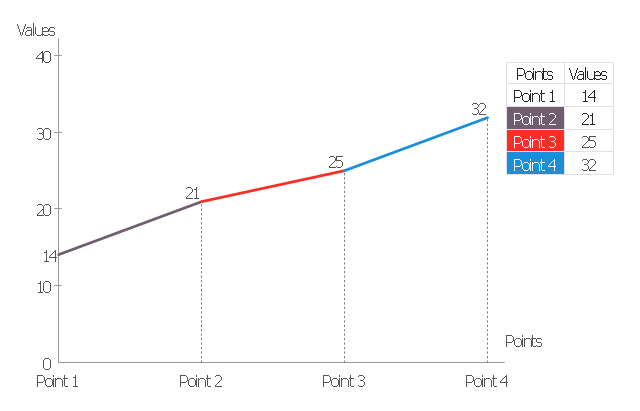
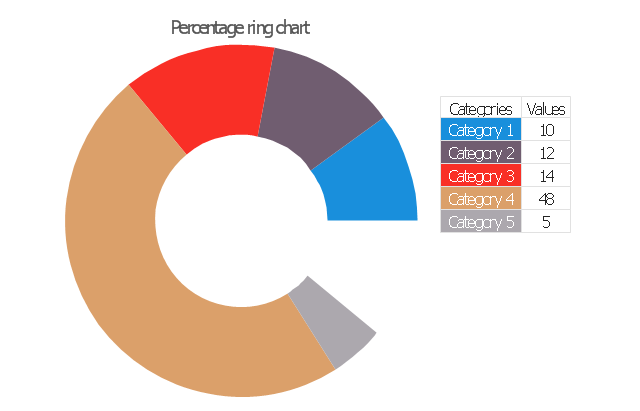
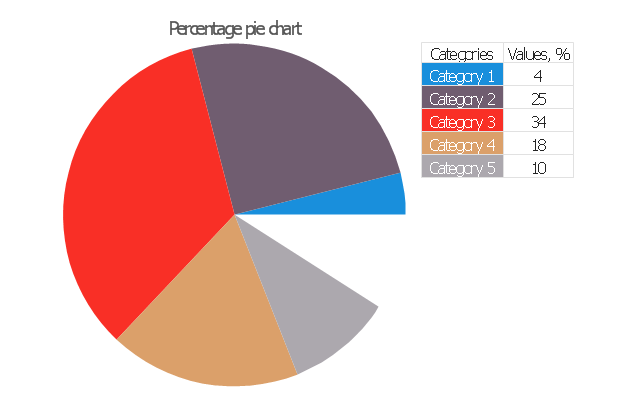
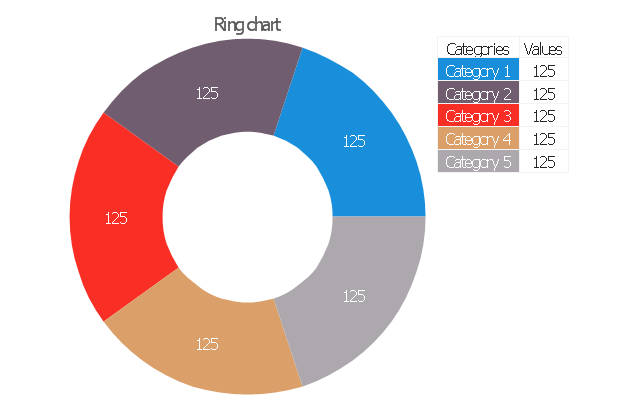
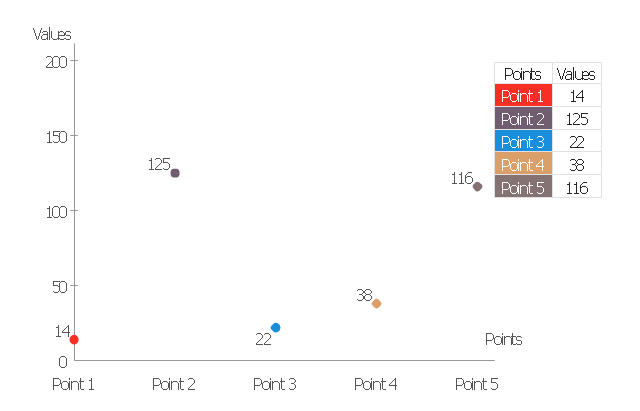
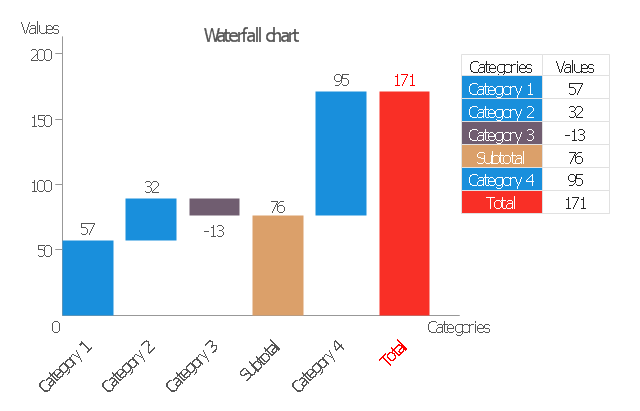
The vector stencils library "Data-driven charts" contains 13 data-driven graphs and charts: area chart, divided bar diagram, double bar graph, frequency histogram, horizontal bar chart, line graph, percentage ring chart, percentage pie chart, scatter plot, column chart, waterfall chart.
Use it to visualize quantitative data in your data-driven infographics.
The graphs example "Data-driven charts - Vector stencils library" was created using the ConceptDraw PRO diagramming and vector graphics software extended with the Data-driven Infographics solution from the area "What is infographics" of ConceptDraw Solution Park.
Entity Relationship Diagram - ERD - Software for Design Crows Foot ER Diagrams
ER-model is a data model which lets describe the conceptual schemes in a specific subject area. It can help to highlight the key entities and specify relationships that can be established between these entities. During the database design, it is realized the transformation of ER model into certain database scheme based on the chosen data model (relational, object, network, etc.). There are used two notations for ERDs: Crow's Foot and Chen's. Crow's Foot notation proposed by Gordon Everest represents the entity by rectangle containing its name (name must be unique within this model), and relation - by the line which links two entities involved in relationship. The relationship's plurality is graphically indicated by a "plug" on the end of the link, the optionality - by a circle. Entity-Relationship Diagrams based on Crow's Foot notation can be easily drawn using the ConceptDraw PRO. Extended with Entity-Relationship Diagram (ERD) solution, it is the best ERD diagrams software with powerful tools and ready design elements for Crow's Foot and Chen notations.
How To use House Electrical Plan Software
How we can conduct the electricity at house correctly without a plan? It is impossible. The House electrical diagram depicts locations of switches, outlets, dimmers and lights, and lets understand how you will connect them. But design of House Electrical Plan looks a complex task at a glance, which requires a lot of tools and special experience. But now all is simple with all-inclusive floor plan software - ConceptDraw PRO. As a house electrical plan software, the ConceptDraw PRO contains libraries with a large range of professional lighting and electrical symbols, ready-to-use electrical plans samples and examples, and built-in templates for creating great-looking Home floor electrical plans. It is a fastest way to draw Electrical circuit diagrams, Electrical wiring and Circuit schematics, Digital circuits, Electrical equipment, House electrical plans, Satellite television, Cable television, Home cinema, Closed-circuit television when are used the tools of Electric and Telecom Plans Solution from ConceptDraw Solution Park. Files created in Visio for Mac app can be easily imported to ConceptDraw PRO. Also you may import stencils and even libraries. Try for free an alternative to Visio that Apple users recommend.
Bubble diagrams with ConceptDraw PRO
Using ConceptDraw you will be able to create bubble diagrams from the ready ConceptDraw library objects or make your own objects. The created diagram can be saved and edited, objects can be moved and links between them will be automatically repainted after object moving because of using the ConceptDraw connectors.
 School and Training Plans
Planning a school and its campus layout needs to depict the premises, represent internal spaces, location of windows and direction of natural light. Detailed classroom seating chart helps you visualize location of the blackboard and desks, taking into account the specifics of the room and its lighting, with a goal to design the classroom to be comfortable for each pupil and teacher.
ConceptDraw PRO The best Business Drawing Software
ConceptDraw PRO is new software for business and technical drawing. Powerful business drawing tools, extensive libraries with pre-drawn shapes, free samples of business drawings, technical drawings and flowcharts, support of many graphic formats enable users to visually develop their business drawings charts and diagrams in any combination of drawings, diagrams and flow charts.- Bar Chart Software | Bar Graphs | Chart Maker for Presentations ...
- Online Double Bar Graph Maker
- Free Double Bar Graph Maker
- Double Bar Graph Generator
- Chart Maker for Presentations | Bar Graphs | Column Chart Software ...
- Bar Chart Template for Word | Double bar graph - Template | Chart ...
- Explain Bar Graphs Double Bar Graphs Histogram And Pie Chart In
- Double Bar Graph Software
- Chart Maker for Presentations | Bar Graphs | Basic Flowchart ...
- Double Bar Graph Maker Online
- Bar Chart Software | Chart Maker for Presentations | Create Graphs ...
- Spatial Infographics | Double Bar Graph Definition Wikipedia
- Double bar graph - Template | Sales Growth. Bar Graphs Example ...
- Bar Chart Examples | Bar Graphs | Double Bar Graph On Rainfall
- Easy Bar Graph Maker Free
- Double Bar Graph Templete
- Bar Graphs | Bar Diagrams for Problem Solving. Create ...
- Bar Chart Template for Word | Column Chart Template | Chart Maker ...
- Create Graphs and Charts | Bar Chart Software | Pie Chart Software ...



-data-driven-charts---vector-stencils-library.png--diagram-flowchart-example.png)
_Win_Mac.png)


