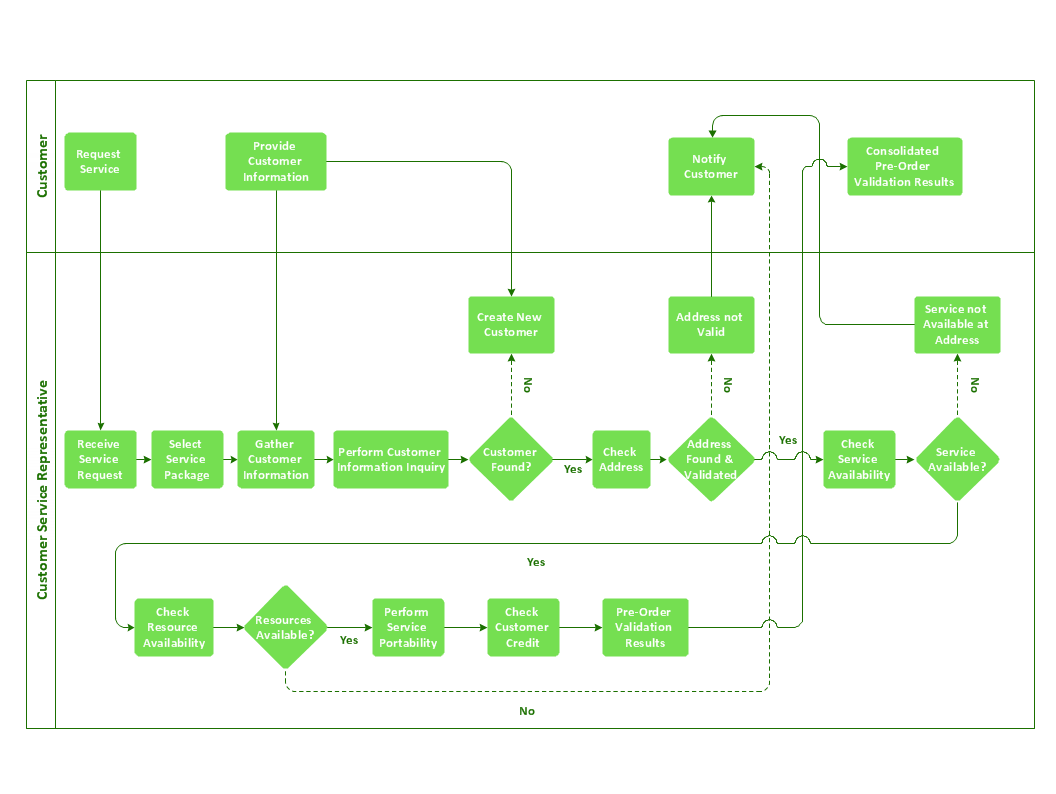
Double-headed Cross Functional Flowchart
ConceptDraw DIAGRAM is a powerful tool that helps you create a Cross Functional Flow Chart quickly and easily. Fine-tuning the objects in ConceptDraw DIAGRAM allows you to create a really professional finished article. ConceptDraw Arrows10 Technology gives drawing connectors a smart behavior that provides quick and precise placement, allows for easy changes and automatic rearrangement.Accounting Flowchart Symbols
Accounting is a well known and popular tool used for gaining full quantitative information about the finances. The accounting process includes extensive set of activities that begins with transactions and ends with closing of books. It contains all financial information for a given organization, the data about incomes, expenditures, purchases, sales, return, payroll, and many other numerical information. The excellent possibility to create great-looking Accounting Flowcharts is offered by professional ConceptDraw DIAGRAM diagramming and vector drawing software. It includes the Accounting Flowcharts solution containing wide variety of predesigned accounting flowchart symbols. All symbols are easy recognizable, commonly used, vector and professionally designed, so are capable effectively save your time and efforts when representing all stages of accounting work process, the flow of data in an organization, accounting procedures and processes, documents, tasks, responsible people, users, components and authorizations.How to Build a Flowchart
The ConceptDraw DIAGRAM is a professional software for quick creating great looking flowcharts. The vector stencils from object libraries allows you to use RapidDraw technology. By the clicking on direction arrows one can add new object to flowcharts. This technology gives to users the ability to fast creating visualization for the structural data. Learn the basics of flowcharting and see how to build create a flowchart using ConceptDraw automatic drawing tools.The vector stencils library "Accounting flowcharts" contains 14 flow chart symbols.
This library was created according the article " Accounting Flowchart: Purchasing, Receiving, Payable and Payment"
http:/ / accounting-financial-tax.com/ 2010/ 04/ accounting-flowchart-purchasing-receiving-payable-and-payment/
from the website " Accounting Financial Tax" http:/ / accounting-financial-tax.com a> , with the kind permission of the author.
Use this library for drawing the accounting flowcharts in the ConceptDraw PRO software extended with the Accounting Flowcharts solution from the Finance and Accounting area of ConceptDraw Solution Park.
www.conceptdraw.com/ solution-park/ finance-accounting-flowcharts
Accounting Information Systems Flowchart Symbols
The excellent possibility to create professional-looking Accounting Flowcharts is offered by powerful ConceptDraw DIAGRAM software and its Accounting Flowcharts solution. This solution contains wide variety of predesigned accounting flowchart symbols commonly used when representing the flow of data, documents, tasks and people responsible for performance each stage of accounting work process.Offensive Play – Double Wing Wedge – Vector Graphic Diagram
Producing football diagrams using ConceptDraw DIAGRAM software takes seconds, not minutes. Thanks to Football solution from the Sport area of ConceptDraw Solution Park all you need is just drag and drop ready-to-use positions objects to a template contains football field, and place positions on the field.Data Flow Diagram
Data Flow Diagram (DFD) is part of the Structured Systems Analysis and Design Methodology (SSADM), which is intended for information systems projection and analysis. Data Flow Diagrams allow graphically to represent the data flows in the information system and analyze the data processing during the structural projection. This type of diagrams lets visually show a work of information system and results of this work, it is often used in connection with human processes and can be displayed as a Workflow diagram. Data Flow Diagram visualizes processes and functions, external entities, data depositories, and data flows connecting these elements and indicating direction and data character. Each of these elements used for DFD has its own graphical notation. There are two notations to draw DFDs - Yourdon & Coad and Gane & Sarson. ConceptDraw DIAGRAM extended with Data Flow Diagrams (DFD) solution from the Software Development area is ideal for designing professional-looking DFDs, which can be then easily exported in various formats.Purchase Process Flow Chart, Receiving Process Flow Chart, Accounting Flowchart Example.
The purchasing process follows very specific guidelines and includes a purchasing cycle flowchart and receiving process flow chart. Common key elements of purchasing process. It is important to know how purchasing processes work and how each operation is done.Sales Steps
Helps to create professionally looking and detailed Sales Flowcharts with all sales steps visually represented on them. Use the Sales Flowcharts Solution for ConceptDraw DIAGRAM software to create your own Sales Flowcharts of any complexity quickly, easily and effectively to use them successfully in your work activity. ConceptDraw DIAGRAM diagramming and vector drawing software supplied with unique Sales Flowcharts solution from the Marketing area of ConceptDraw Solution Park allows fast and easy visualize all sales steps of the sales process on a sales process Map or sales process flowchart, and then realize them easily.Chart Maker for Presentations
Easy charting software comes with beautiful chart templates and examples. This makes it easy to create professional charts without prior experience.Cross-Functional Flowchart
Use of Cross-Functional Flowchart is a clear way of showing each team member’s responsibilities and how processes get shared or transferred between different responsible people, teams and departments. Use the best flowchart maker ConceptDraw DIAGRAM with a range of standardized cross-functional flowchart symbols to create the Cross-Functional Flowcharts simply and to visualize the relationship between a business process and the functional units responsible for that process. To draw the most quickly Cross-Functional Flowcharts, Cross Functional Process Maps, or Cross Functional Process Flow Diagrams, start with a Cross-functional flowchart samples and templates from ConceptDraw Solution Park. The ConceptDraw Arrows10 and RapidDraw technologies will be also useful for you in drawing. ConceptDraw DIAGRAM supports designing both types - horizontal and vertical Cross-functional flowcharts. A vertical layout makes the accents mainly on the functional units while a horizontal layout - on the process. If you need a Visio alternative in Mac OS X, try ConceptDraw DIAGRAM. Its interface is very intuitive and it’s actually much easier to use than Visio, yet somehow it’s just as powerful if not more so. ConceptDraw DIAGRAM performs professional quality work and seamless Visio interaction.Flow Chart in Chemistry
Flow charts are widely used in chemistry and simplify the understanding of the chemical processes, basic structure of a system, its components, and interactions, materials flow throughout a process. ConceptDraw DIAGRAM software extended with Chemical and Process Engineering solution is the easiest for using a multifunctional diagramming tool, which helps to create a Flow Chart in chemistry, Chemistry diagrams of any type, and Chemistry flow diagrams with ease. Illustrate any chemical processes in minutes.Value stream with ConceptDraw DIAGRAM
The Value stream is a totality of all actions on the projection, order composition and production: starting from creation a product project to launching this product, from order to delivery, from extraction of raw materials to ready product manufacturing. Value stream mapping is a process of visualization of these actions and creation of a detailed and graphical map.SDL Flowchart Symbols
Drawing the diagrams we try to find in help the powerful software and now we have the ConceptDraw DIAGRAM. The ability easily create the SDL diagrams is made possible thanks to unique Specification and Description Language (SDL) Solution from the Industrial Engineering Area of ConceptDraw Solution Park. This solution extends ConceptDraw DIAGRAM libraries - SDL Connectors and SDL Diagrams that contain 70 predesigned SDL flowchart symbols.Pie Chart Word Template. Pie Chart Examples
The Pie Chart visualizes the data as the proportional parts of a whole and looks like a disk divided into sectors. The pie chart is type of graph, pie chart looks as circle devided into sectors. Pie Charts are widely used in the business, statistics, analytics, mass media. It’s very effective way of displaying relative sizes of parts, the proportion of the whole thing.Electrical Symbols — Semiconductor Diodes
In electronics, a diode is a two-terminal electronic component that conducts primarily in one direction (asymmetric conductance); it has low (ideally zero) resistance to the flow of current in one direction, and high (ideally infinite) resistance in the other. A semiconductor diode is a crystalline piece of semiconductor material with a p–n junction connected to two electrical terminals. Today, most diodes are made of silicon, but other semiconductors such as selenium or germanium are sometimes used. 26 libraries of the Electrical Engineering Solution of ConceptDraw DIAGRAM make your electrical diagramming simple, efficient, and effective. You can simply and quickly drop the ready-to-use objects from libraries into your document to create the electrical diagram.Ordering Process Flowchart. Flowchart Examples
A flowchart is a widely used type of diagram that visually represents an algorithm, workflow or process, using the boxes of various kinds to depict the steps and connecting them with arrows to show the order of execution these steps. Еhe ConceptDraw DIAGRAM supplied with Accounting Flowcharts Solution from the Finance and Accounting Area of ConceptDraw Solution Park is a powerful diagramming and vector drawing software which ideally suits for designing Ordering Process Flowchart of any complexity.Visio Files and ConceptDraw
Visio Files and ConceptDraw. ConceptDraw DIAGRAM is compatible with MS Visio.VDX formatted files.VDX is Visio’s open XML file format, and it can be easily imported and exported by ConceptDraw DIAGRAM.Security Plans
No security system cannot be constructed without detailed security plan, or even a set of plans in some cases. ConceptDraw DIAGRAM software offers the Security and Access Plans Solution from the Building Plans Area to help you design the Security Plans for any premises and of any complexity.HelpDesk
How to Make a Logistics Flow Chart
ConceptDraw Logistics Flow Charts solution is a tool for designing Logistics Flow Charts, Diagram, and related infographics. You can create a variety of logistics visualizations: Logistics flow chart, Inventory flow chart, Warehouse flowchart, Logistics process flow diagram, Warehouse management flow chart, Inventory control flowchart, or any other Logistics diagram for your business and effectively use them to promote the goods and services, and to enhance the economic stability of your business.- Basic Flowchart Symbols and Meaning | ConceptDraw Arrows10 ...
- Basic Flowchart Symbols and Meaning | Double Sided Arrow In Visio
- How to Create Flowchart Using Standard Flowchart Symbols ...
- Basic Flowchart Symbols and Meaning | Offensive Play – Double ...
- Basic Flowchart Symbols and Meaning | Data Flow Diagram | Create ...
- Double -headed Cross Functional Flowchart | Flowchart Interview ...
- Swim Lane Diagrams | Double -headed Cross Functional Flowchart
- Basic Flowchart Symbols and Meaning | Double Arrow On A Chart
- Process Flowchart | Double -headed Cross Functional Flowchart ...