The vector stencils library "Sales arrows" contains 57 arrow symbols.
Use these arrow icon set to draw your sales flowcharts, workflow diagrams and process charts with the ConceptDraw PRO diagramming and vector drawing software.
The arrow pictograms library "Sales arrows" is included in the Sales Flowcharts solution from the Marketing area of ConceptDraw Solution Park.
Angle arrow
Arc arrow
Arki arrow
Arrow fork
Arrow loop
Bent arrow
Chevron arrow
Circular arrow
Circular motion arrows

Clockwise arrow
Corner arrow
Counterclockwise arrow
Crossed arrows

Curved left arrow
Curved right arrow
Curving directional arrow
Cycle arrow
Diagonal arrow
Double arc arrow
Double headed arrow
Double headed semicircle arrow
Down arrow
Dual short arc arrow
Elbow arrow
Fat arrow
Go back arrow
Interaction arrows

L-shaped arrow
Left arrow
Lightning arrow
Long arc arrow
Looping arrows

Merging arrows

Moving down arrow
Moving up arrow
Recycling arrows

Refresh arrows

Ribbon arrow
Right arrow
Rotating arrows

S-shaped arrow
Sector arrow
Semicircle arrow
Short arc arrow
Single headed arrow
Small arrow
Split arrow
Straight arrow
Triangle arrow
Turn left arrow
Turn right arrow
Turn round arrow
Turned arrow
Up arrow
U-shaped arrow
Vertical moving arrow
Wavy arrow
The vector stencils library "Sales arrows" contains 57 arrow symbols.
Use these arrow icon set to draw your sales flowcharts, workflow diagrams and process charts with the ConceptDraw PRO diagramming and vector drawing software.
The arrow pictograms library "Sales arrows" is included in the Sales Flowcharts solution from the Marketing area of ConceptDraw Solution Park.
Use these arrow icon set to draw your sales flowcharts, workflow diagrams and process charts with the ConceptDraw PRO diagramming and vector drawing software.
The arrow pictograms library "Sales arrows" is included in the Sales Flowcharts solution from the Marketing area of ConceptDraw Solution Park.
Angle arrow
Arc arrow
Arki arrow
Arrow fork
Arrow loop
Bent arrow
Chevron arrow
Circular arrow
Circular motion arrows
Clockwise arrow
Corner arrow
Counterclockwise arrow
Crossed arrows
Curved left arrow
Curved right arrow
Curving directional arrow
Cycle arrow
Diagonal arrow
Double arc arrow
Double headed arrow
Double headed semicircle arrow
Down arrow
Dual short arc arrow
Elbow arrow
Fat arrow
Go back arrow
Interaction arrows
L-shaped arrow
Left arrow
Lightning arrow
Long arc arrow
Looping arrows
Merging arrows
Moving down arrow
Moving up arrow
Recycling arrows
Refresh arrows
Ribbon arrow
Right arrow
Rotating arrows
S-shaped arrow
Sector arrow
Semicircle arrow
Short arc arrow
Single headed arrow
Small arrow
Split arrow
Straight arrow
Triangle arrow
Turn left arrow
Turn right arrow
Turn round arrow
Turned arrow
Up arrow
U-shaped arrow
Vertical moving arrow
Wavy arrow
Basic Flowchart Symbols and Meaning


Funnel Chart

Functional Block Diagram

Daisy Chain Network Topology

 Scrum Workflow
The Scrum Workflow Solution extends the capabilities of ConceptDraw PRO 10 with a large collection of professionally-designed samples and a selection of ready-to-use scrum design elements: scrum diagrams and arrows, scrum icons of people, artifacts, workflow, workspace and other colorful scrum clipart, and also scrum charts.
HelpDesk
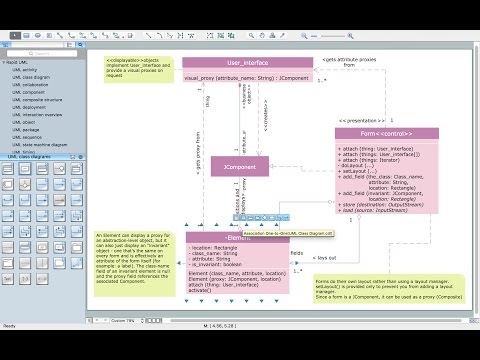
How to Make a UML Diagram in ConceptDraw PRO

HelpDesk
How to Create a Bar Chart in ConceptDraw PRO

Examples of Flowcharts, Org Charts and More


- Curved Arrow Clipart Png Transparent
- Curved Cycle Arrow Transparent Background
- Magnifying Glass Icon Transparent Png
- Round Transparent Glass Documents Icon Png
- Circular Arrows Diagrams | Collaboration life-cycle - Circular arrow ...
- Transparency And Disclosure In Corporate Best Diagram
- Sign With Up And Down Arrows
- Arrow Half Circle
- Yellow Arrows Down Png