ConceptDraw DIAGRAM - Organizational chart software
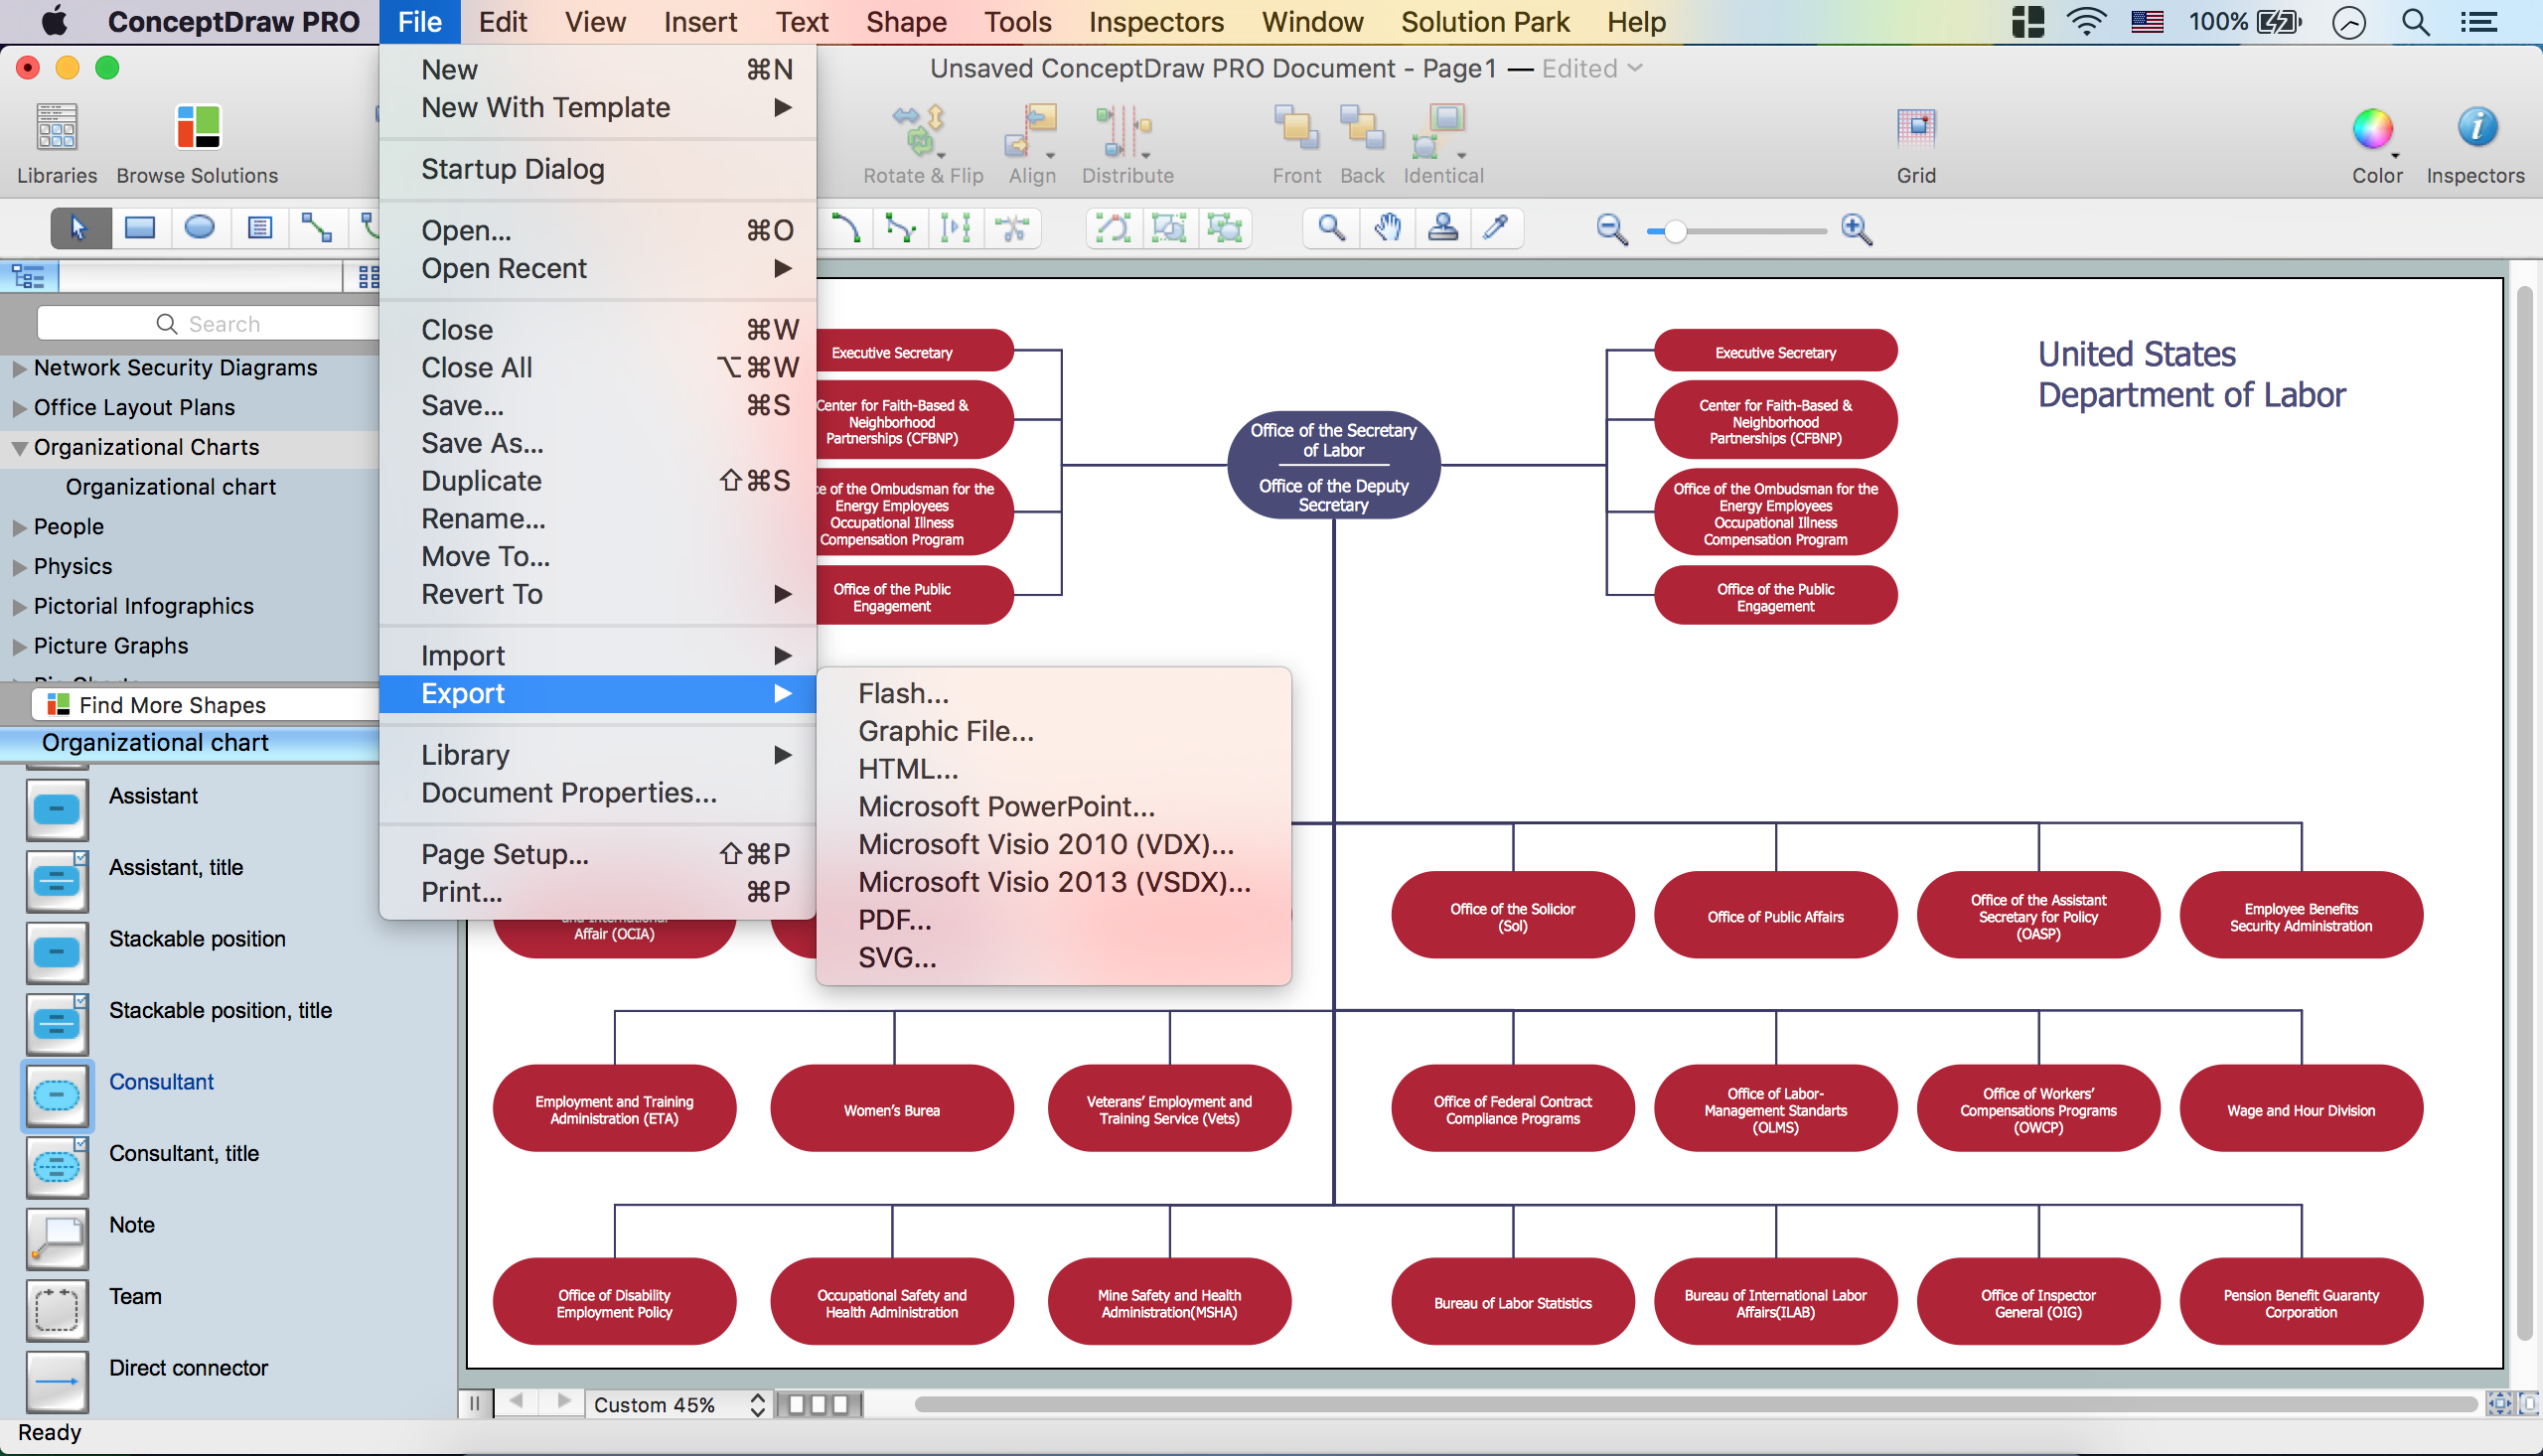
Organizational Chart is a scheme which visualizes the composition of departments, sectors and other functional units of an organization, and also fixed relationships that exist between divisions and employees. ConceptDraw DIAGRAM enhanced with Organizational Charts solution is a powerful and cost effective Organizational chart software, which allows to automate the process of creation the high standard organizational charts, flow charts, time lines, and much more diagrams. It can be applied for analyzing organizational structure and drawing single or multi-page Organizational Charts with hyperlinks for the companies of any type, size and direction. Visualize the structure using the orgchartal tools, create easily as never before the Company Organizational Chart, Corporate Organizational Chart, Hospital Organizational Chart, University Organizational Chart, Hotel Organizational Chart, and then export, send by e-mail or publish it on Web in minutes, to communicate and discuss with colleagues or any other interested people.Create Organizational Chart
ConceptDraw DIAGRAM software is greatly powerful in many fields due to the large collection of provided solutions by ConceptDraw Solution Park, among them the cost effective Organizational Chart design capabilities. Organizational Charts Solution from the Management Area of ConceptDraw Solution Park perfectly suits for analyzing the organizational structures, visualizing and designing Organizational Charts for the companies of any sizes, for creation the hotel organizational chart, hospital organizational chart, corporate organizational chart, different flow charts, time lines, and much more. Organizational Charts Solution makes ConceptDraw DIAGRAM the perfect analyzer tool for managers and administrative staff. It offers plenty of useful and convenient tools for ConceptDraw DIAGRAM users, including the set of Organizational chart templates that make the process of creation Organizational Charts on their base easier and quicker, extensive Organizational chart library of tasks-specific symbols and shapes, helpful Organizational chart examples and samples.Organizational Structure
The organizational structure reflects the composition and hierarchy of company's divisions, determines the distribution of authorities and responsibilities within the organization, and facilitates the understanding by workers their responsibilities. It also defines the group of people making key decisions at the company. Visualization of organizational structure of any company, organization or institution is not an easy task, because sometimes the company may include several departments, each with more than thousand persons. For such large organizations often are created the Organizational charts for every department separately. There are many ways of organization's structuring, which determine its work. Often happens that organizational structure adapts to production process. ConceptDraw DIAGRAM extended with unique Organizational Charts solution from Management area of ConceptDraw Solution Park is a powerful organizational structure software, which ideally suits for developing Organizational Charts of any type and any complexity.Org Chart Diagram
ConceptDraw Office products and PM solutions included to ConceptDraw Solution Park support many project methodologies, among them Agile and Simple Projects, which help in implementing the best practices in project management. ConceptDraw Office applications give effective support in solving the issues related with planning, tracking, events, milestones, resource usage, and many other project management functions. ConceptDraw MINDMAP software provides the great advantages of a Mind Map hierarchical tree structure during the process of development the organizational structure of an organization. When you need to make the Organizational Chart, you can use any ConceptDraw DIAGRAM or ConceptDraw MINDMAP software. If you already have a designed Mind Map, it is incredibly easy to generate an Organizational Chart directly from ConceptDraw MINDMAP. You need simply double-click the corresponding icon, all the rest will be made automatically. The Organizational Chart will be created from the active page of your map, outputted to ConceptDraw DIAGRAM and opened in Slideshow mode.Root Cause Tree Diagram
The Root Cause Tree Diagram is a chart that helps determine the root causes of factors that influence the problem, to represent and analyze them. This diagram is constructed separately for each high priority factor. First it is needed to identify the root causes for a factor, display their structure and then propose the possible corrective actions. But how to create Root Cause Tree Diagram with the least efforts and time? ConceptDraw MINDMAP will effectively help you in drawing MINDMAP Root Cause Tree Diagram and Root Cause Analysis Tree Diagram used for further formulation of actions. The Root Cause Tree Diagram template, which can be opened at the program from the Input tab, supplies you with a basic mind map structure for your diagram. The central idea describes briefly a problem, the main topics represent the high-level causes of a problem, their subtopics give more details about the different parts of given causes. At the last level of tree are described the potential solutions to each of detailed parts of the causes.Genomics
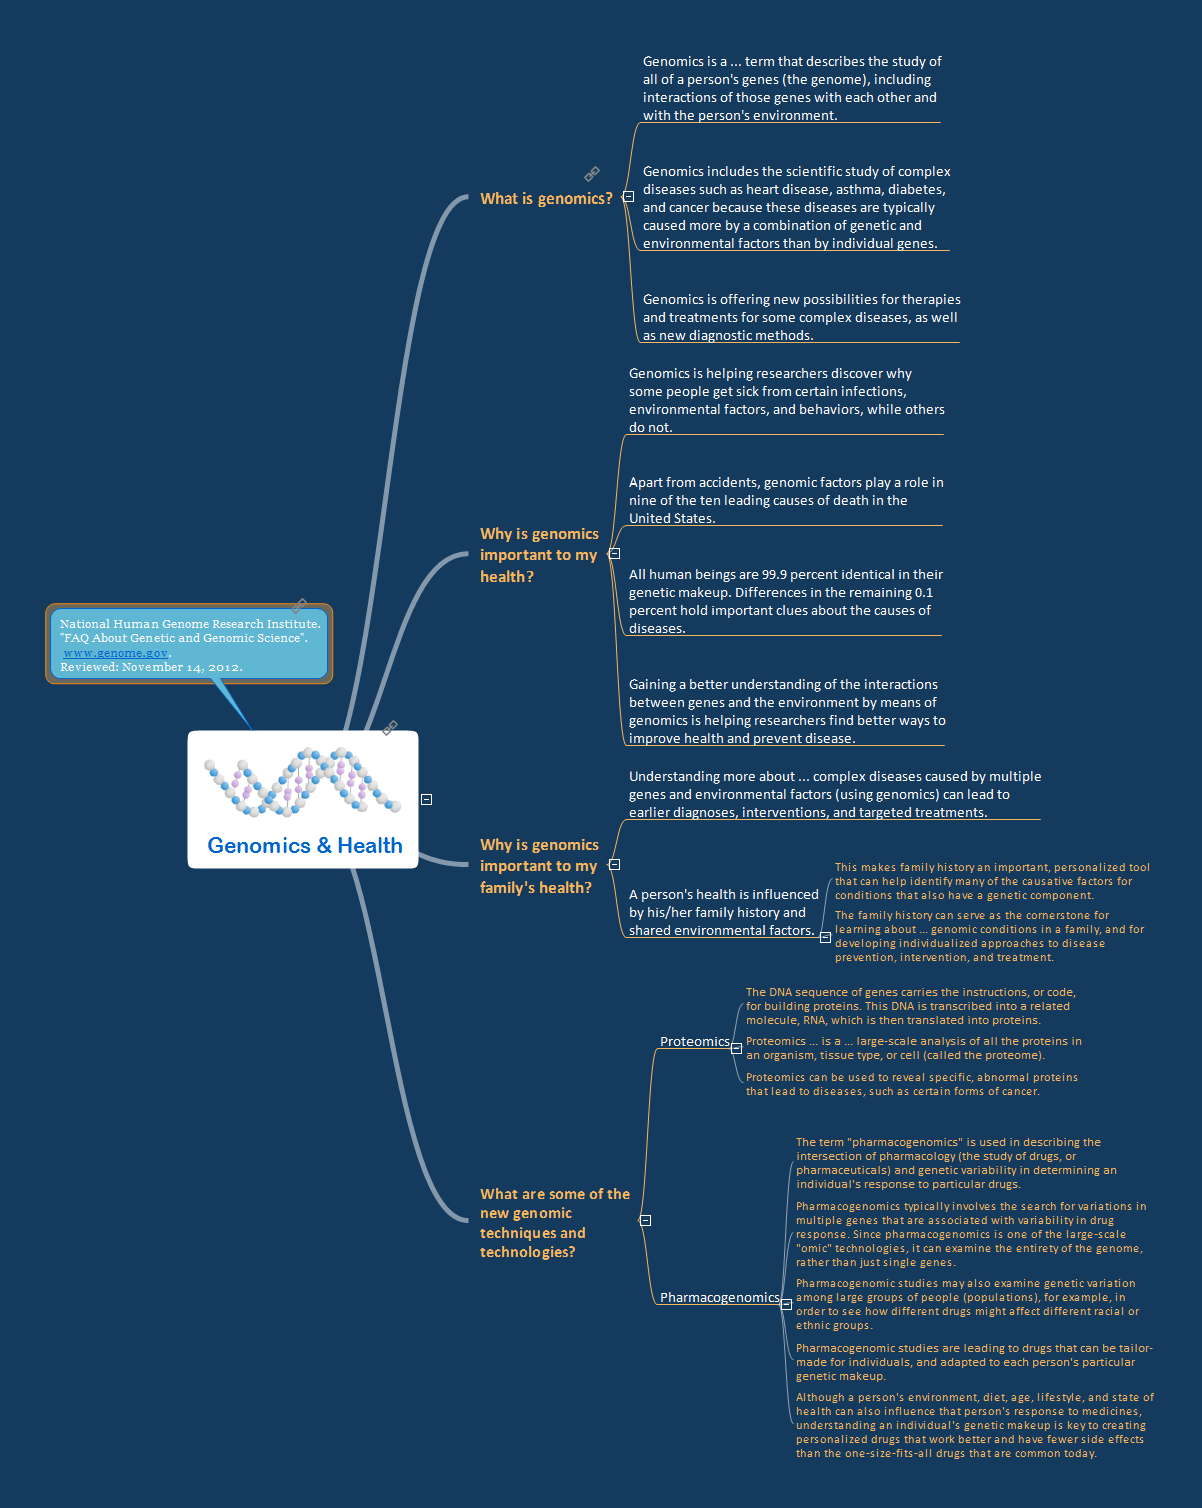
Genomics is a section of molecular genetics devoted to the study of genome and genes of living organisms. The human's genome is a totality of inheritable material that is enclosed in a person's cell. The main task of genomics is the establishment of a complete genetic characterization of the whole cell, definition the number of contained genes and their sequences, number of nucleotides in each gene and their sequences, the functions of each gene in relation to the metabolism of an organism. Genomics allows to express the essence of an organism, its potential opportunities, generic and individual differences from other organisms, to anticipate the reaction to the external impacts, knowing the sequence of nucleotides in each of genes and number of genes. Genetic engineering rapidly moves, the new discoveries and achievements in this field occur in incredibly fast pace. This Mind Map represents the list of FAQs about genetic and genomic science, and illustrates how useful are the Mind Maps for structuring information and explaining the complex subjects in a simplified manner. ConceptDraw MINDMAP lets you easy create Mind Map representing the main thesises for any science.SWOT analysis matrix diagram templates
SWOT analysis or SWOT Matrix is a structured method of the planning which is used to evaluate the S - Strengths, W - Weaknesses, O - Opportunities, and T - Threats involved in a business project or commercial venture. It was introduced at 1960s as a tool for learning the internal capabilities of large companies. A SWOT analysis includes the indication of the project's goal, specification the critical factors (internal and external) that influence on the achievement of company's business goal, that are conducive or adverse for this. SWOT analysis is effective way to successful business, to win in rivalry with competitors and become the best on your market. SWOT Analysis solution from Management area of ConceptDraw Solution Park makes the ConceptDraw DIAGRAM a powerful SWOT and TOWS analysis software. It contains a lot of vector design elements of SWOT and TOWS matrices, numerous examples and templates. The predesigned SWOT example or template is a fastest way of drawing professional-looking SWOT Matrix and presenting analysis results in just one click.SWOT Template
The SWOT and TOWS Matrix Diagrams solution from the ConceptDraw Solution Park gives a simple visual support for all steps of a SWOT analysis process, which is a popular strategic planning method used to evaluate the Strengths, Weaknesses, as well as Opportunities and Threats facing a project. Strengths are the project's characteristics giving it the advantages over the others, weaknesses are the characteristics placing the team at the disadvantage relatively to others, opportunities are the elements that the project can exploit to its advantage and threats are the elements that can cause the troubles. The results of a correctly performed SWOT analysis help to achieve effectively the main objective. The SWOT templates included to SWOT and TOWS Matrix Diagrams solution for ConceptDraw DIAGRAM isually support the identifying of internal and external factors that are favorable or unfavorable. Making the SWOT analysis and completing the SWOT Matrix by simple filling a SWOT template, you can then export it to large variety of available formats: PowerPoint presentation, PDF, image files, and others.
 Food Court
Use the Food Court solution to create food art. Pictures of food can be designed using libraries of food images, fruit art and pictures of vegetables.
- Organizational Structure | Create Organizational Chart ...
- Organizational Structure | Create Organizational Chart ...
- How to Draw an Organization Chart | Pyramid Diagram | Hiring ...
- Organizational Structure | Organizational Structure | Organigrams ...
- ConceptDraw DIAGRAM Compatibility with MS Visio | Block ...
- Organizational Chart Template | Flowchart Software | Pie Chart ...
- 25 Typical Orgcharts | | Visio Files and ConceptDraw | Org Chart ...
- Functional Organizational Structure | Organizational Chart | How to ...
- Organizational chart - County administrator office | How to Draw an ...
- Network Community Structure. Computer and Network Examples ...
- Mind Map Organization Chart Software Free Download
- ConceptDraw DIAGRAM Compatibility with MS Visio | ConceptDraw ...
- Ppt On Decision Making Structure Download
- Downloading the Old Versions of ConceptDraw Products ...
- Corporation Clipart
- Downloading the Old Versions of ConceptDraw Products ...
- Organization Chart Software | Organizational Chart Templates ...
- Design elements - Scrum arrows | Agile Mind Maps: Exploring the ...
- How to Use ConceptDraw Single User License | Project Exchange ...


