Horizontal Org Flow Chart
This sample was created in ConceptDraw DIAGRAM diagramming and vector drawing software using the Organizational Charts Solution from the Management area of ConceptDraw Solution Park. The Organizational Chart is a diagram that shows the structure of the organization, different levels of management, hierarchy and the relationships of the organization parts.
 Data Flow Diagrams (DFD)
Data Flow Diagrams solution extends ConceptDraw DIAGRAM software with templates, samples and libraries of vector stencils for drawing the data flow diagrams (DFD).
Data Flow Diagrams
Data Flow Diagram (DFD) is a special chart type which lets graphically illustrate the "flow" of data through an information system. So the Data Flow Diagrams can be successfully used for visualization of data processing or structured design, for creation an overview of the system, for business process modeling, for exploring the high-level design in terms of data flows and documenting the major data flows. Inclusion of powerful Data Flow Diagrams solution to the Software Development area of ConceptDraw Solution Park makes the ConceptDraw DIAGRAM a beneficial data flow diagramming software and supplies it with numerous collection of quick-start templates, professionaly designed samples, and extensive range of ready-for-use vector objects consisting the Data Flow Diagrams, Gane-Sarson Notation, and Yourdon and Coad Notation libraries. Use the ConceptDraw DIAGRAM application to design easy and quickly the Data Flow Diagrams including the data storages, data flows, external entities, functional transforms, control transforms and signals.Education Infographics
The Education Infographics are popular and effectively applied in the educational process. Now you don't need to be an artist to design colorful pictorial education infographics thanks to the unique drawing tools of Education Infographics Solution for ConceptDraw DIAGRAM diagramming and vector drawing software.Infographic Tools
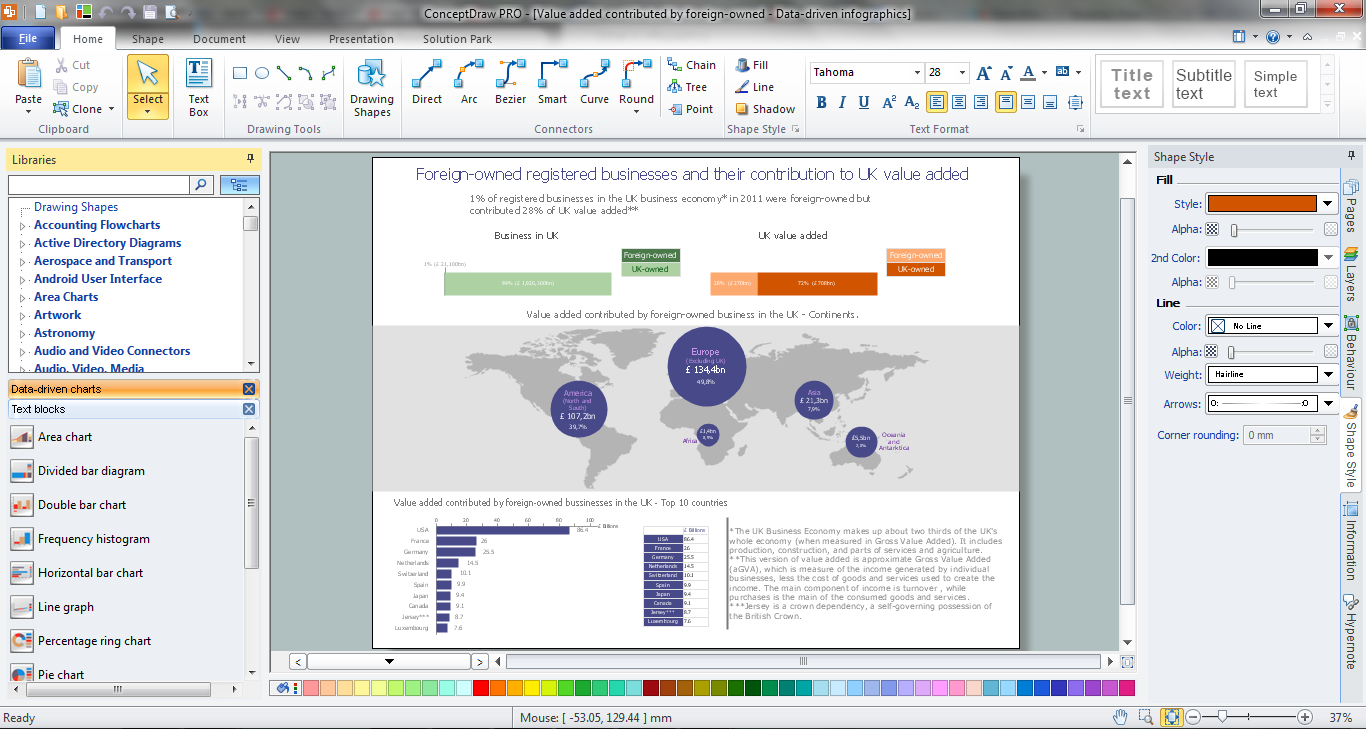
ConceptDraw DIAGRAM diagramming and vector drawing software offers the best infographic tools - Data-driven Infographics Solution from the “Infographics” Area of ConceptDraw Solution Park.Flowchart Software
Flowchart is a simple diagram, map or graphical schematic representation the sequence of actions within a process. It is ideal for displaying how a process currently flows or can function ideally. The Flowcharts let define the steps and boundaries of a process, uncover problems or miscommunications. The Flowcharts are widely used in education, software development, business, economics, thanks to their visuality they are ideal for presentations, reports, for using on conferences to help the audience comprehend the content better, or easy find flaws in a process flow diagrams. ConceptDraw DIAGRAM is professional flowcharts software and feature-rich flowchart maker, which supports Mac OS X and Windows. It contains at ConceptDraw Solution Park a rich set of stencils and professional flowchart symbols for design. It lets create simply professional-looking Flowcharts based on thousand free flowchart templates, colored symbols and examples. ConceptDraw DIAGRAM is a 3 times cheaper alternative to MS Visio available for both Mac and PC. It’s is another full featured business and technical diagramming application that can easily take care of Visio files within OS X. Another bonus with ConceptDraw DIAGRAM – it's cross-platform. You can work on a document in both OS X and Windows, skipping Visio entirely.
Data Flow Diagram Software
Data Flow Diagrams (DFDs) are successfully used when studying the business processes or systems that involve the transfer of data. They are a visual way to represent the data processing, to model and visualize the flow of data through a computer system and functional requirements for a designed system. They are the good business modeling tool to describe the business events and interactions, the physical systems involving the storage and transfer of data. ConceptDraw DIAGRAM supplied with Data Flow Diagrams solution from Software Development area of ConceptDraw Solution Park is a modern and powerful data flow diagram software. This solution offers large set of predesigned DFD vector objects, grouped to three libraries: Data Flow Diagrams, Gane-Sarson Notation, and Yourdon and Coad Notation. All they and also collection of DFD samples and built-in templates make a good base for ConceptDraw DIAGRAM users, providing them all conditions for easy creation the Data Flow Diagrams and Data Flow Models of any complexity.Sign Making Software
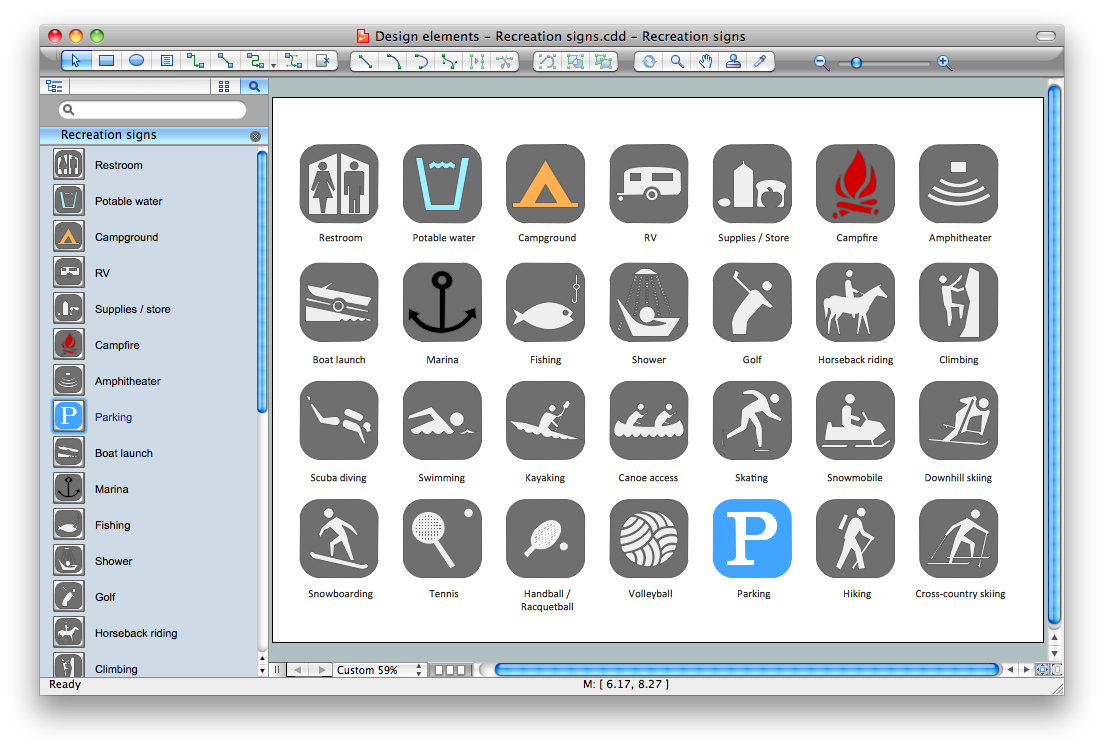
ConceptDraw DIAGRAM is a powerful sign making software thanks to the vector stencils library "Recreation signs". This library is included in the Directional Maps solution from the Maps area of ConceptDraw Solution Park. Sign making software is very useful tool for professional sign-making business. Use ConceptDraw DIAGRAM and make sure that now sign making is easier and timesaving than ever!Collaborative business with ConceptDraw DIAGRAM
Collaborative business with ConceptDraw. Collaborative-business strategies - the sharing of business information and ideas among partners, suppliers and customers can help increase sales, improve service, and decrease costs.WBS Diagram
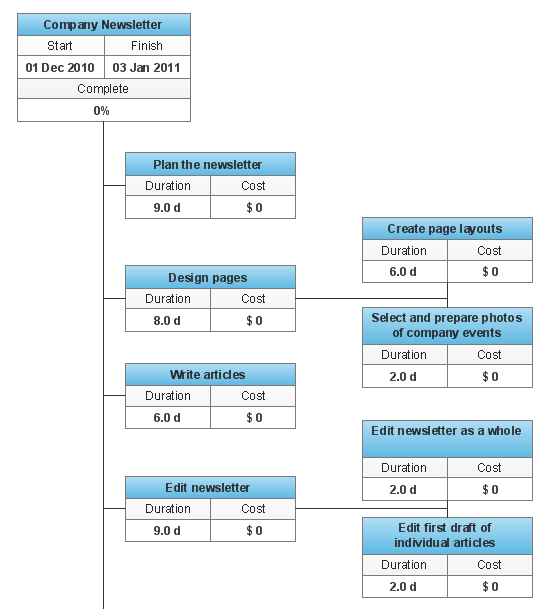
To simplify the managing of a complex project, it is advisable to divide it into the components in a hierarchical tree structure, called by Work Breakdown Structure (WBS). WBS diagram clearly divides all the works and tasks that must be done to achieve the objectives of the project, into the smaller operations and actions. Such division of the project accelerates the allocation of resources and establishes the areas of responsibility for each team member. WBS diagram is one of the main planning tools frequently used by project managers, it allows you to clearly define the entire scope of work on the project, to describe in details the content of these works and to arrange them in a form of hierarchical structure. The better you detailing the WBS, the more accurate will be all actions. The optimal size of elements is from the few days to several months. ConceptDraw Office suite applications and ConceptDraw Solution Park contain a lot of tools actively applied in project management, in their quantity is included the possibility of easy creation professional-looking Work Breakdown Structure (WBS) diagrams.HelpDesk
How to Create a Data Flow Diagram
Data flow diagramming is a highly effective technique for showing the flow of information through a system. Data flow diagrams reveal relationships among and between the various components in a program or system. DFD is an important technique for modeling a system’s high-level detail by showing how input data is transformed to output results through a sequence of functional transformations. The set of standard symbols is used to depict how these components interact in a system. ConceptDraw DIAGRAM allows you to draw a simple and clear Data Flow Diagram using special libraries.Diagramming Software for Design UML Collaboration Diagrams
ConceptDraw helps you to start designing your own UML Collaboration Diagrams with examples and templates.
Garrett IA Diagrams with ConceptDraw DIAGRAM
Garrett IA diagrams are used at development of Internet-resources, in particulars at projecting of interactions of web-resource elements. The diagram of information architecture of the web resource which is constructed correctly with necessary details presents to developers the resource in comprehensible and visual way.Data Flow Diagram
Data Flow Diagram (DFD) is the part of the Structured Systems Analysis and Design Methodology (SSADM), which is intended for information systems projection and analysis. Data Flow Diagrams allow graphically represent the data flows in information system and analyze the data processing during the structural projection. This type of diagrams lets visually show a work of information system and results of this work, it is often used in connection with human processes and can be displayed as Workflow diagram. Data Flow Diagram visualizes processes and functions, external entities, data depositories, and data flows connecting these elements and indicating direction and data character. Each of these elements used for DFD has its own graphical notation. There are two notations to draw DFDs - Yourdon & Coad and Gane & Sarson. ConceptDraw DIAGRAM extended with Data Flow Diagrams (DFD) solution from Software Developmant area is ideal for designing professional looking DFDs, which can be then easily exported in various formats.Radar Chart
This sample shows the Radar Chart that compares the internet dimensions in the four countries. The Radar Chart represents the multivariate data as a two-dimensional chart with three or more variables displayed on the axes that start in one point. The Radar Charts are used in the quality management, business, analytics and sport.Diagramming Software for Design UML Communication Diagrams
UML Communication Diagram depicts the interactions between objects or parts in terms of sequenced messages and describes both the static structure and dynamic behavior of a system.
Accounting Flowchart Symbols
Accounting is a well known and popular tool used for gaining full quantitative information about the finances. The accounting process includes extensive set of activities that begins with transactions and ends with closing of books. It contains all financial information for a given organization, the data about incomes, expenditures, purchases, sales, return, payroll, and many other numerical information. The excellent possibility to create great-looking Accounting Flowcharts is offered by professional ConceptDraw DIAGRAM diagramming and vector drawing software. It includes the Accounting Flowcharts solution containing wide variety of predesigned accounting flowchart symbols. All symbols are easy recognizable, commonly used, vector and professionally designed, so are capable effectively save your time and efforts when representing all stages of accounting work process, the flow of data in an organization, accounting procedures and processes, documents, tasks, responsible people, users, components and authorizations.Software Diagram Templates
Use Software Diagram Templates from the solutions of Software Development area for ConceptDraw DIAGRAM to create your own professional looking Software Diagrams in minutes. The Software Diagrams designed with ConceptDraw DIAGRAM are vector graphic documents and are available for reviewing, modifying, converting to a variety of formats (image, HTML, PDF file, MS PowerPoint Presentation, Adobe Flash or MS Visio XML), printing and send via e-mail in one moment.Data Flow Diagram (DFD)
A Data Flow Diagram (DFD) illustrates the flow of data through an information system, visualizes how the information is handled in terms of inputs and outputs, how the data enter to system and leave it. It is effective to use a Data Flow Diagram for creation the system's overview, to show the system's scope and boundaries. There are two different types of notations for DFDs: Yourdon-Coad and Gane-Sarson, which differ in visual representations for processes, data flow, data stores, external entities, etc. Thus, for example the processes are depicted as circles in Yourdon-Coad notation and as rounded squares in Gane-Sarson notation. Gane-Sarson notation is usually used for visualization information systems and Yourdon-Coad - for system analysis and design. The Data Flow Diagrams solution included to Software Development area of ConceptDraw Solution Park offers a lot of DFD templates, samples and examples, libraries of vector stencils for construction without efforts the DFDs according to both Gane-Sarson and Yourdon-Coad notations.Basic Diagramming
Block diagrams are essentially a very simple format of diagrams. A variety of commonly used shapes and connecting lines, rules of construction and actions pertaining to them, make Block diagram a versatile and flexible tool for many forms of industry. Another advantage is the ease with which Block diagrams can be constructed, especially if you use professional diagramming software. ConceptDraw DIAGRAM software is an example of purpose built application designed with the form of process modeling in mind. It includes Block Diagrams solution from Diagrams area of ConceptDraw Solution Park for easy drawing professional-looking simple diagram - Block diagram, and a lot of other useful solutions for designing variety of other types of diagrams, schematics and flowcharts (Line graphs, Bar charts, Organizational charts, Histograms, Pie charts, Process flowcharts, Fault tree analysis diagrams, Scatter plots, Venn diagrams, Bubble diagrams, etc.). The RapidDraw functionality of ConceptDraw DIAGRAM lets create new objects and their connectors in just single-click.
- Data Flow Diagram Pdf Free Download
- Free Download Pdf Of Data Flow Diagram Dfd
- Software Engineering Dfd Project Pdf Free
- Data Flow Diagrams (DFD) | Context Diagram Pdf Free Download
- Software Engineering Dfd Project Pdf Free Download
- Data Flow Diagram Symbols Pdf
- Data Flow Diagrams Examples In Software Engineering Pdf Examples
- Data Flow Diagrams (DFD) | Software Engineering Dfd Pdf
- How To Draw Process Flow Diagram Pdf Download
- Softwere Engineer Dfd Book Pdf
- Data Flow Diagrams (DFD) | Example For Dfds Library Management ...
- Dfd Diagram Example Pdf Download
- How To Convert a Circle-Spoke Diagram to an Adobe PDF Using ...
- Methods Of Algorithm Representation With Data Flow Diagram Pdf
- Data Flow Diagram Symbol Pdf
- ConceptDraw PRO DFD Software | Data Flow Diagrams (DFD) | Dfd ...
- Data Flow Diagrams (DFD) | Dfd In Software Engineering Pdf
- Data Flow Diagrams (DFD) | ATM UML Diagrams | Dfd And Er For ...
- ConceptDraw PRO DFD Software | Dfd Drawing Software Free ...
- Data Flow Diagram Of Online Event Management System On Pdf


