This site uses cookies. By continuing to browse the ConceptDraw site you are agreeing to our Use of Site Cookies.

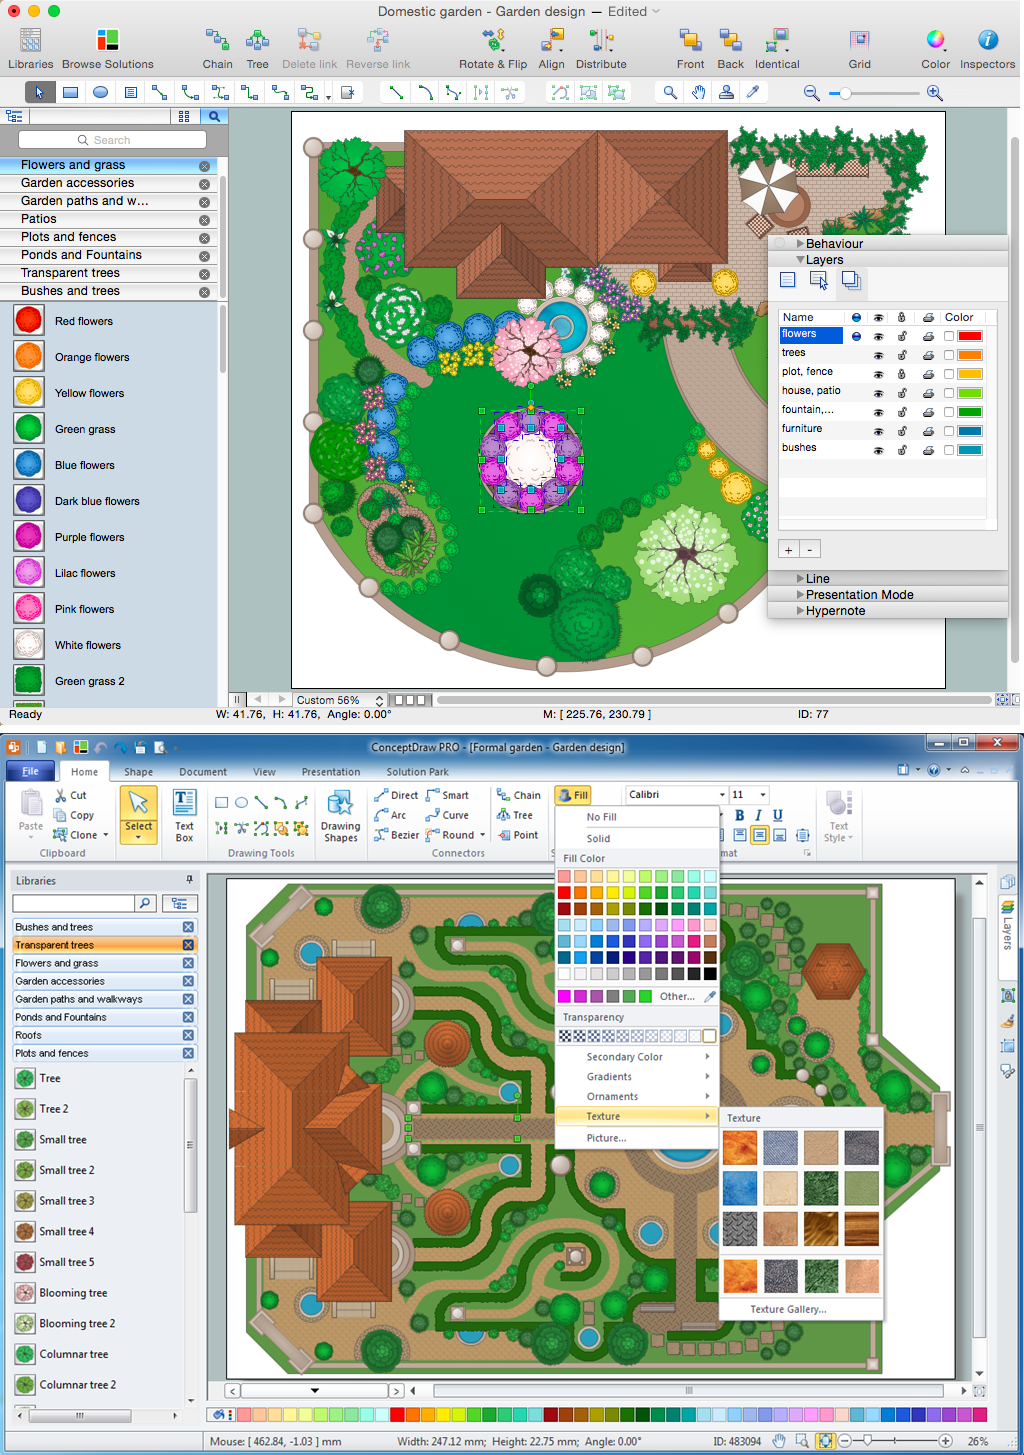
Landscape Architecture with ConceptDraw DIAGRAM

The landscape architecture includes landscape design, planning, and realization, as well as management of resources and buildings. The smaller scale landscape projects are well known as landscape design and garden design. The landscape design documentation is created independently from the project's scale and includes sketches, general plan and working documentation. On this stage the ConceptDraw DIAGRAM software extended with Landscape & Garden solution is irreplaceable assistant for you. The landscape designs created using ConceptDraw DIAGRAM are effectively used by landscape architects and engineers, also by landscape managers who maintain parks, gardens, natural landscapes like woodlands or nature reserves, and artificial landscapes. The Landscape and Garden solution contains 14 libraries with a lot of vector graphics objects of trees, flowers, bushes, fountains, ponds, furniture, roofs, patios, fences, garden accessories, entertainment, roads, junctions, etc., that are suitable for any gardener to simply design a wonderful garden.

Horizontal Org Flow Chart

This sample was created in ConceptDraw DIAGRAM charting and vector drawing software using the Organizational Charts Solution from the Management area of ConceptDraw Solution Park. The Organizational Chart is a diagram that shows the structure of the organization, different levels of management, hierarchy and relationships of the organization parts.

Flowchart Marketing Process. Flowchart Examples

This sample shows the Flowchart that displays the layout and work flow of the cloud marketing platform. This diagram has a style of the marketing brochure. This style displays the central product that is related to the other issues. Using the ready-to-use predesigned objects, samples and templates from the Flowcharts Solution for ConceptDraw DIAGRAM you can create your own professional looking Flowchart Diagrams quick and easy.

Bar Chart Examples

Complete set of bar chart examples is produced using ConceptDraw software. Surfing bar chart examples you can find an example that is the best for your case.

UML Tool & UML Diagram Examples

The Unified Modeling Language (abbr. UML) is a general-purpose modeling language widely used in the field of software development, software engineering, education, science, industry, business. In 1997 the UML was approved as a standard by the OMG (Object Management Group) and in 2005 was published as ISO standard by the International Organization for Standardization. UML is widely and succesfully applied for optimization the process of software systems development and business systems analysis. There are used 14 types of UML diagrams, 7 from them depict structural information, another 7 types represent different types of behavior and aspects of interactions. Design of any automated process is easy with ConceptDraw DIAGRAM and unique Rapid UML solution from the Software Development area, which provides numerous UML examples, templates and vector stencils libraries for drawing all types of UML 1.x and UML 2.x diagrams. Use of predesigned UML diagram examples and templates lets you quickly start drawing your own UML diagrams in ConceptDraw DIAGRAM software.

Create Floor Plans Easily
with ConceptDraw DIAGRAM Floor Design Software

How to create Floor Plan Design easy and effectively? You can invite an interior designer and trust this work to him, which is usually expensive and result may not always meet your expectations. Another way is to design it yourself, but at this case you need to have special skills, knowledges and abilities, among them basic knowledge of the composition rules, color theory, materials science and software for interior design development. The ability to use specialized software for drawing is especially valuable, useful and saves your time. ConceptDraw DIAGRAM is one of the best among similar software, it offers extensive functionality, powerful tools, a lot of features, and is simple for using, so can be applied by everyone without efforts. Enhanced with Floor Plans and other solutions from the Building Plans area, the ConceptDraw DIAGRAM software helps easily create unique and harmonious interior designs, and draw in desired scale professional-looking Floor Plans and Layouts for homes, apartments, hotels, offices, and other buildings. ConceptDraw DIAGRAM is a full Visio compatibility and better alternative for students, teachers and business professionals to reliably create kinds of flowcharts, organizational charts, network diagrams, floor plans, electrical diagrams, software design diagrams, maps and more.
How to Draw a Floor Plan

playground layout Sport Field Plans

playground layout
Sport Field Plans solution extends ConceptDraw DIAGRAM with samples, templates and libraries of ready-made design elements for developing layouts of sport fields, recreation areas, playground layouts plans, and for professional drawing various sport field plans — for football, basketball, volleyball, golf, baseball, tennis, etc. Depict all your playground layout ideas easily and decisively implement the playground layout designs. Use the final colorful, strict and accurate ConceptDraw's playground layouts when designing the building documentation, brochures, booklets, advertising materials, sports editions, sport maps, business plans, on web sites of sport complexes, sport centers, hotels, etc.

Create Block Diagram

Block diagrams solution extends ConceptDraw DIAGRAM software with templates, samples and libraries of vector stencils for creating the block diagram. Create block diagrams, electrical circuit diagrams, schematics, and more in minutes with ConceptDraw DIAGRAM.

Ishikawa Diagram

In almost every sphere of life and work the people time to time are faced with the fact that on their way there are certain obstacles and problems. But it is not always possible to identify the true cause of particular problem. To understand the basic causes of problems and eliminate them, it is convenient to use the chart of Kaoru Ishikawa - the technique specially designed for this. ConceptDraw DIAGRAM diagramming and vector drawing software extended with Fishbone Diagrams solution from the Management area can help you with construction the Fishbone Diagram also known as Ishikawa Diagram. Ishikawa Diagram shows factors of Equipment, Process, People, Materials, Environment and Management, all affecting the overall problem in one drawing for the further analysis. It is a well effective way to analyze the business problems you must identify and solve.

Process Modelling using Event-driven Process chain

Event-Driven Process Chain Diagrams for improvement throughout an organisation. ConceptDraw DIAGRAM - business process mapping software that reduces the time needed to create a business process model and its excellent business process improvement tools.

Diagramming Software for Design UML Object Diagrams

UML Object Diagram shows the structure of a modeled system at a specific time. ConceptDraw Rapid UML solution delivers libraries contain pre-designed objects fit UML notation, and ready to draw professional UML Object Diagram.

Value Stream & Process Flow Diagramming Software

Value Stream & Process Flow Diagramming Software is a very popular Lean Manufacturing tool that allows to see and visualize in details the company's processes and current state, the flow of material and information, and thus gives the possibility to analyze the efficiency of company's processes and then develop improved processes. Value stream maps are also a good way to define the steps that do not add value to the end product, in other words waste in a company's processes.

Cisco Telepresence. Cisco icons, shapes, stencils and symbols

The ConceptDraw vector stencils library Cisco Telepresence contains videoconference equipment symbols for drawing the computer network diagrams.

Ordering Process Flowchart. Flowchart Examples

A flowchart is a widely used type of diagram that visually represents an algorithm, workflow or process, using the boxes of various kinds to depict the steps and connecting them with arrows to show the order of execution these steps. Еhe ConceptDraw DIAGRAM supplied with Accounting Flowcharts Solution from the Finance and Accounting Area of ConceptDraw Solution Park is a powerful diagramming and vector drawing software which ideally suits for designing Ordering Process Flowchart of any complexity.

How to Create a PowerPoint Presentation from a SWOT Analysis Mindmap

You can use SWOT analysis PowerPoint presentation to represent strengths, weakness, opportunities, and threats involved in your SWOT matrix.

Process Flow Chart Symbols

Process Flow Chart is a visual diagram which shows the processes and relationships between the major components in a system, and uses for this the special process flow chart symbols: special shapes to represent different types of actions and process steps, lines and arrows to represent relationships and sequence of steps. It often named process flow diagram, it use colored flowchart symbols. It is incredibly convenient to use the ConceptDraw DIAGRAM software extended with Flowcharts Solution from the "Diagrams" Area of ConceptDraw Solution Park for designing professional looking Process Flow Charts.

How to Build Cloud Computing Diagram Principal Cloud Manufacturing

The term “cloud” is very popular and widely used now, it is a server, data processing centre, or a network which lets to store the data and software, provides access to them, allows to run applications without installation and gives the possibility to process data hosted remotely via the Internet connection. For documenting the Cloud Computing Architecture with a goal to facilitate the communication between stakeholders are successfully used the Cloud Computing Architecture diagrams. It is convenient and easy to draw various Cloud Computing Architecture diagrams in ConceptDraw DIAGRAM software with help of tools of the Cloud Computing Diagrams Solution from the Computer and Networks Area of ConceptDraw Solution Park.

Value Stream Analysis

ConceptDraw Value Stream Maps are used in lean practice for analysis of manufacturing processes to identify the improvement opportunities.

Account Flowchart
Flowchart Examples

Create your own flow charts of computer or network system account processing using the ConceptDraw DIAGRAM diagramming and vector drawing software extended with the Cross-Functional Flowcharts solution from the Business Processes area of ConceptDraw Solution Park. The flow chart example shows the computer network system account processing.